Recruiters, marketers, and founders all rely on numbers. A quick look at the right dashboard can confirm whether last week's post brought new leads, if a headline tweak boosted profile views, or if an ad still pays for itself. LinkedIn Analytics turns guesswork into data you can act on.
This built-in panel shows profile, page, and ad data as charts you can filter and analyze. Pages, Campaign Manager, and Creator analytics all support native exports to Excel; use the Export button in Analytics & tools. The dashboard shows who viewed your profile (depending on their privacy settings), which posts performed best, and which ads converted.
Why LinkedIn Analytics Matters
- Recruiters see which keywords attract profile views and rewrite headlines accordingly.
- Marketers connect post themes to reactions and prove ROI in their next LinkedIn analytics report.
- Business owners track follower growth and spot when a competitor's post gains traction.
How Do LinkedIn Insights Work?
1. Profile Analytics (Individual Accounts)
- Open LinkedIn, click Me → View Profile.
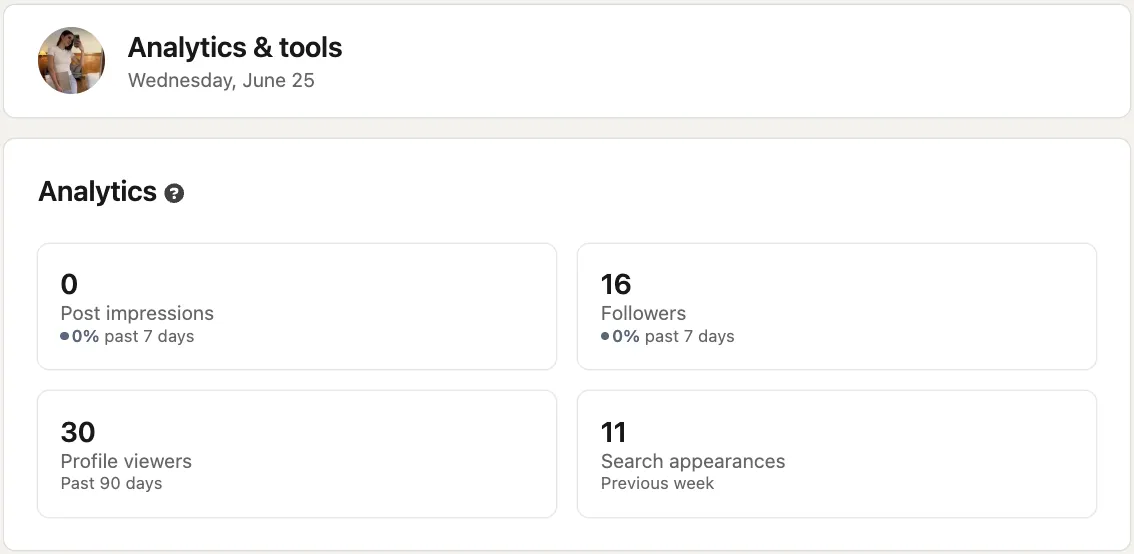
- Scroll to the "Analytics" box to see LinkedIn profile analytics: Profile views, Post impressions, and Search Appearances.
- Click any metric to see job titles, locations, or companies of recent visitors. Viewer details depend on member privacy settings. Premium accounts see up to 365 days of history; Basic accounts see the 5 most recent viewers within 90 days. Demographics only display after enough unique viewers (e.g., video analytics show demographics after at least 25 post impressions).
If you want to see how your profile appears to others before making changes, check this guide on viewing your LinkedIn profile as someone else.
2. Page Analytics (Company Pages)
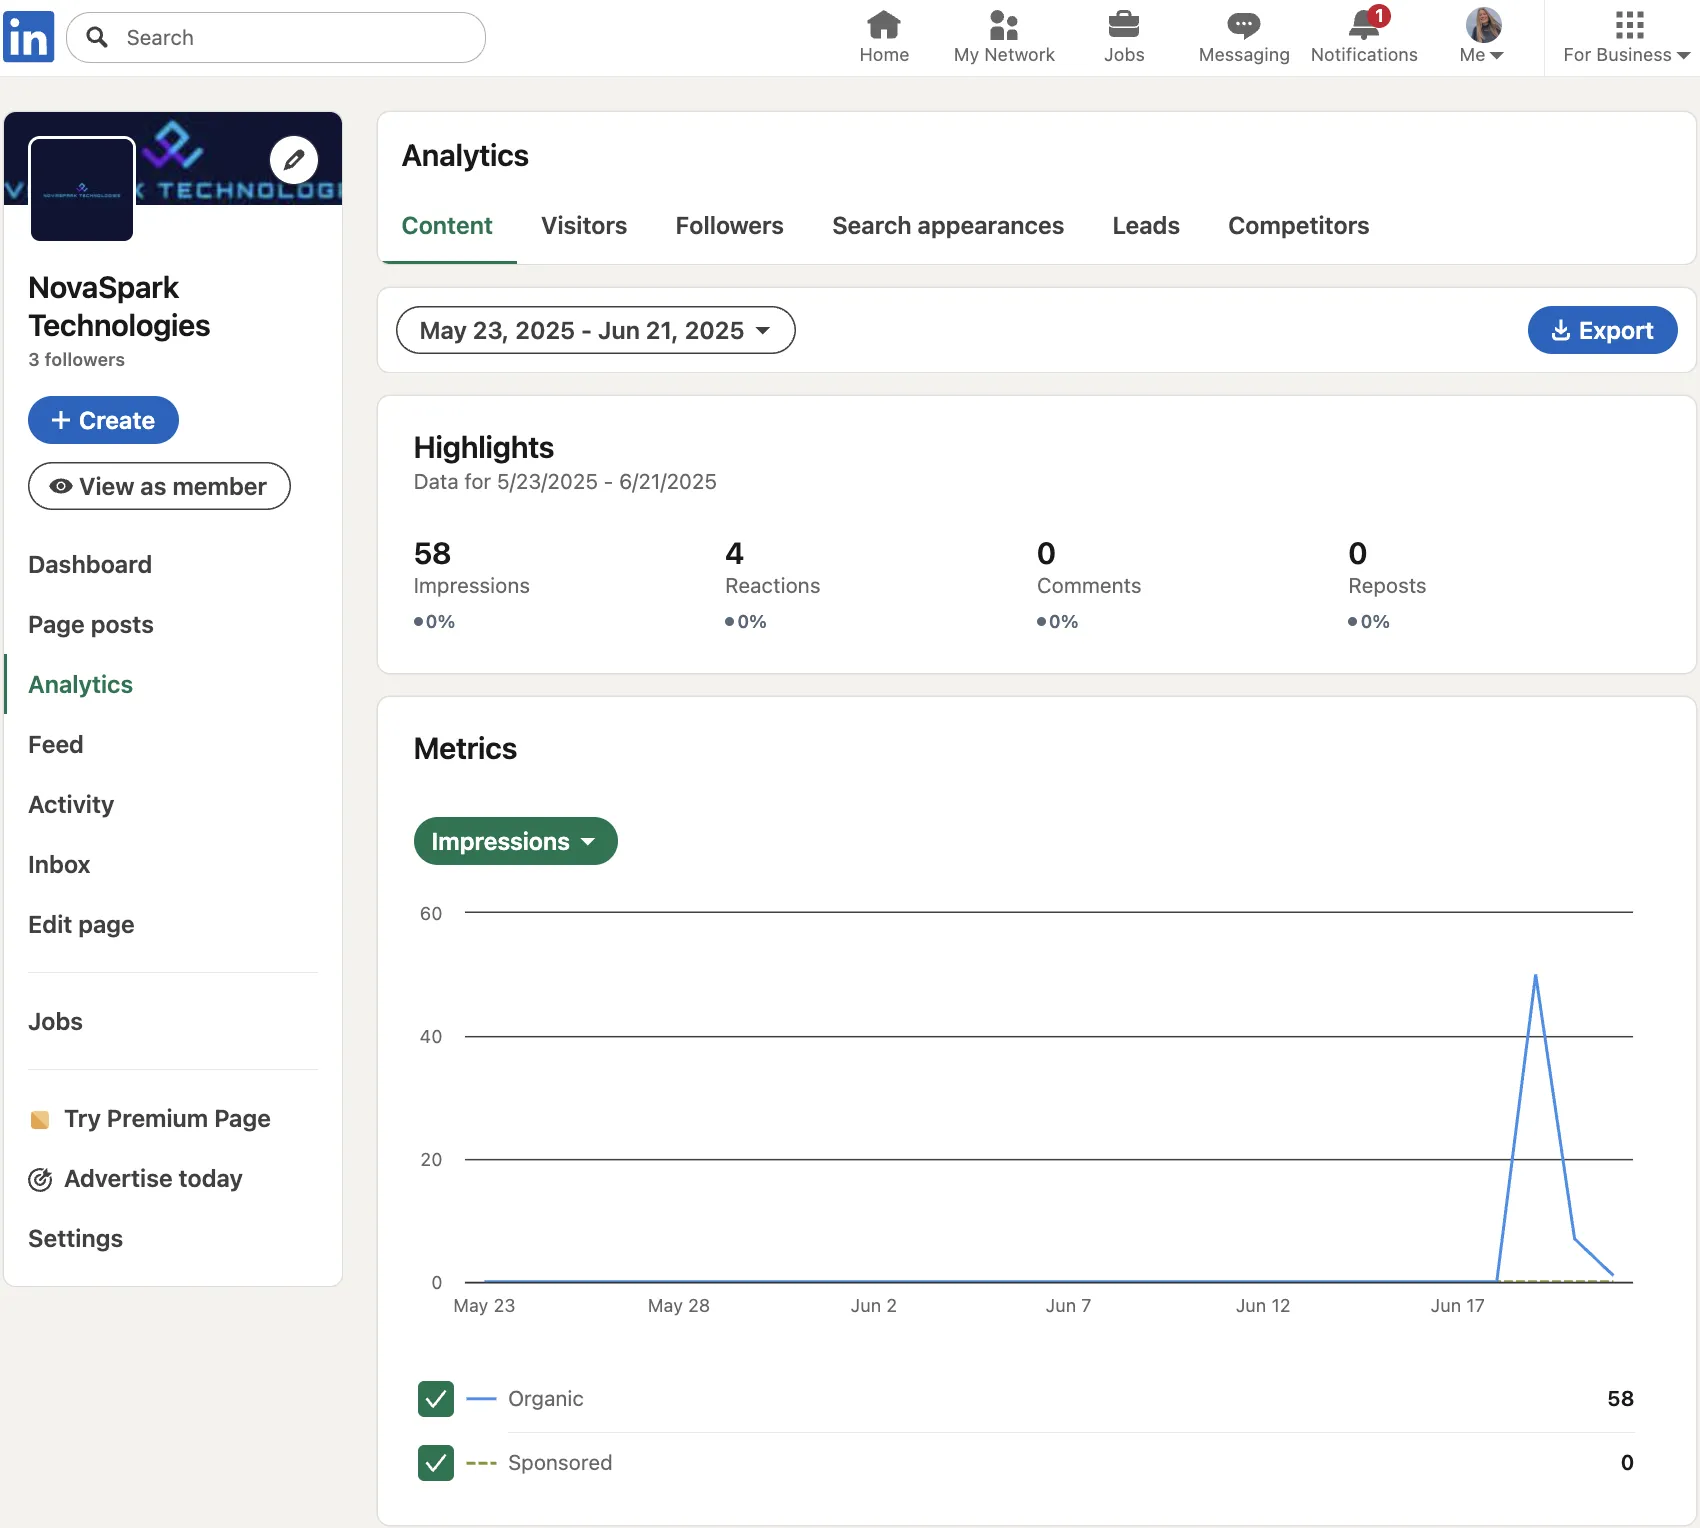
- Switch to Admin view of your page.
- Go to Left menu → Analytics → choose Content, Visitors, Followers, Search Appearances, Leads, Newsletters, or Competitors.
- LinkedIn company page analytics shows demographics, top updates, form fills, and an Export button for Excel.
- Need a weekly slide deck? Tap Export and send the LinkedIn page analytics sheet to your team.
For more on growing and managing your company page, see the guide to managing a LinkedIn company page.
3. Campaign Analytics (Paid Ads)
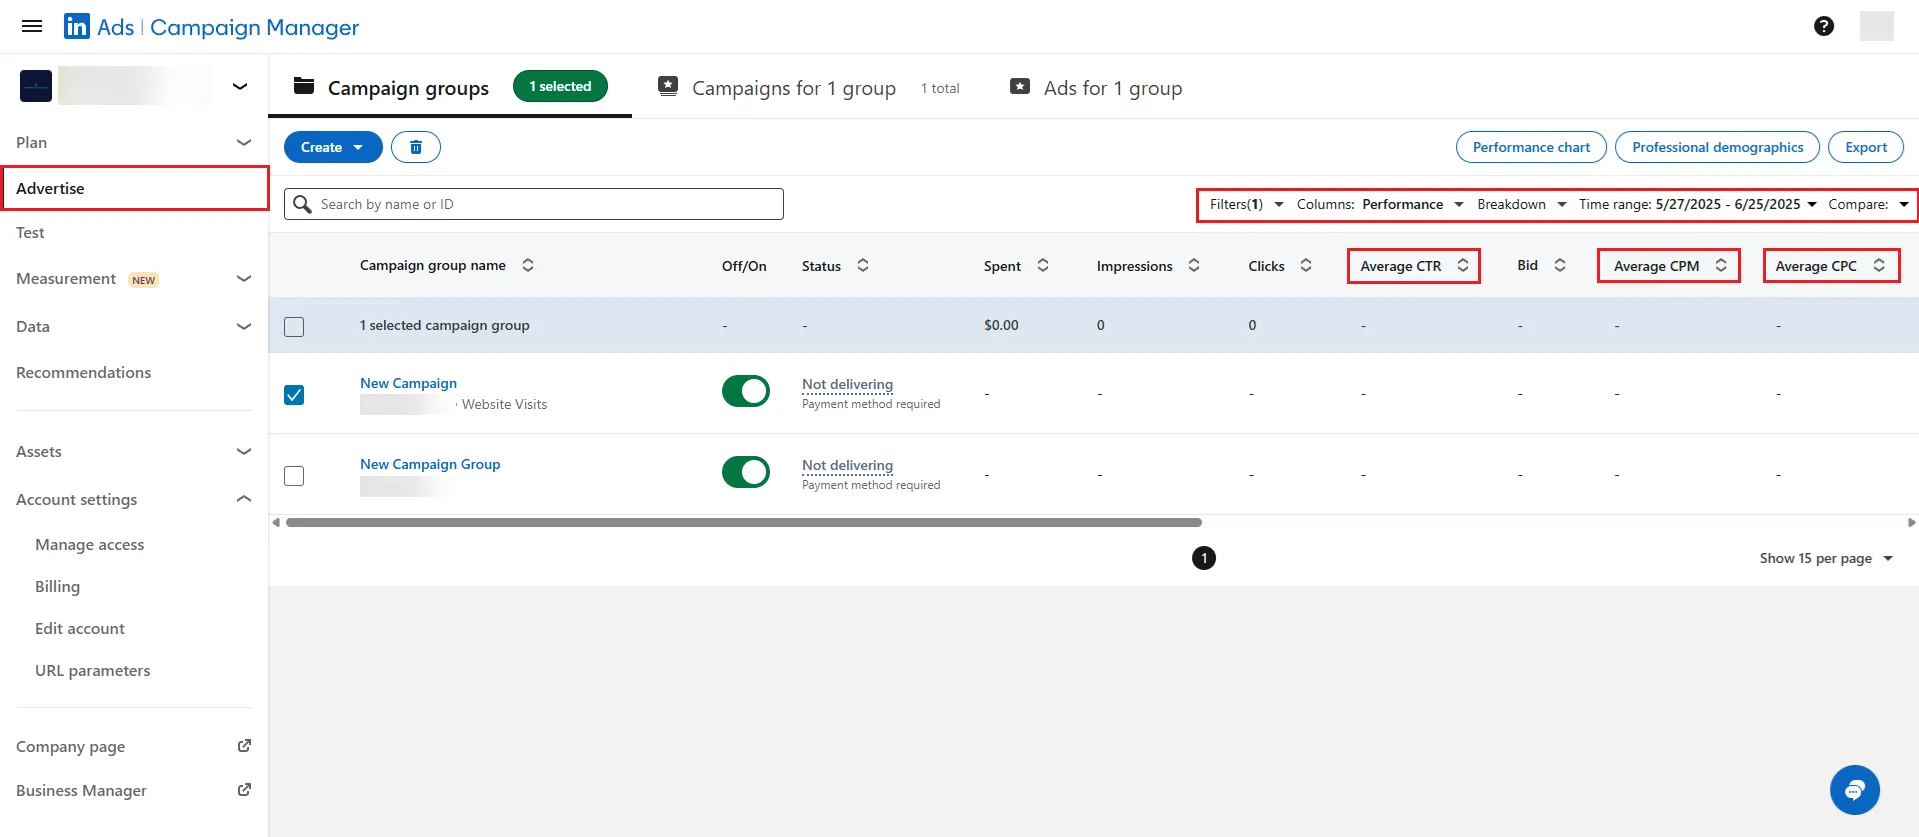
- Sign in to Campaign Manager.
- Go to Account → Campaign → Ad set (LinkedIn renamed these hierarchy terms in Oct 2025; workflows are unchanged).
- Review clicks, impressions, CTR, conversions, and CPL. Filter by objective, format, or date.
- Export a report with spend and lead data so finance can calculate cost-per-lead (saved views are per-user and not shareable; Campaign Manager doesn't export 'Cost per result' columns directly).
Post-Level Insight
Open any update and the LinkedIn post analytics panel appears with likes, comments, shares, video watch time, and clicks on content or company name.
Best Practices
- Tie each dashboard to one goal (awareness, engagement, or leads) before looking at extra metrics.
- Compare week over week in the same view. Switching dashboards distorts trends.
- Use the Competitors tab in Page Analytics to track posting frequency, not just follower counts.
- Schedule a monthly export so leadership gets one spreadsheet.
- Install the Insight Tag and configure conversions early. Past events aren't captured retroactively, so missing setup means missing data.
Bonus Tips
- Toggle date ranges to catch seasonal dips before quarterly reviews.
- Watch whether a personal post increased page followers. Profile and page views often rise together.
- Monitor CPL regularly in Campaign Manager reports. Native threshold alerts aren't available, so schedule weekly exports or use third-party tools.
- A/B test documents versus videos and let the data decide.