A LinkedIn report is a built-in analytics view or exportable file that shows how your LinkedIn Page, ad account, or campaign performs. Inside Page Analytics you see organic data; in Campaign Manager you see paid data. For the full list of key metrics, see section 3 below.
Why LinkedIn Reports Matter
- Marketing teams confirm brand reach through impressions, video views, and engagement.
- Recruiters watch visitor demographics and Talent Pipeline stats to shape employer branding.
- Sales owners monitor click-through rate (CTR), cost per lead (CPL), and conversions to optimize ads.
- Executives receive monthly KPI snapshots before reallocating budget.
How LinkedIn Reports Work
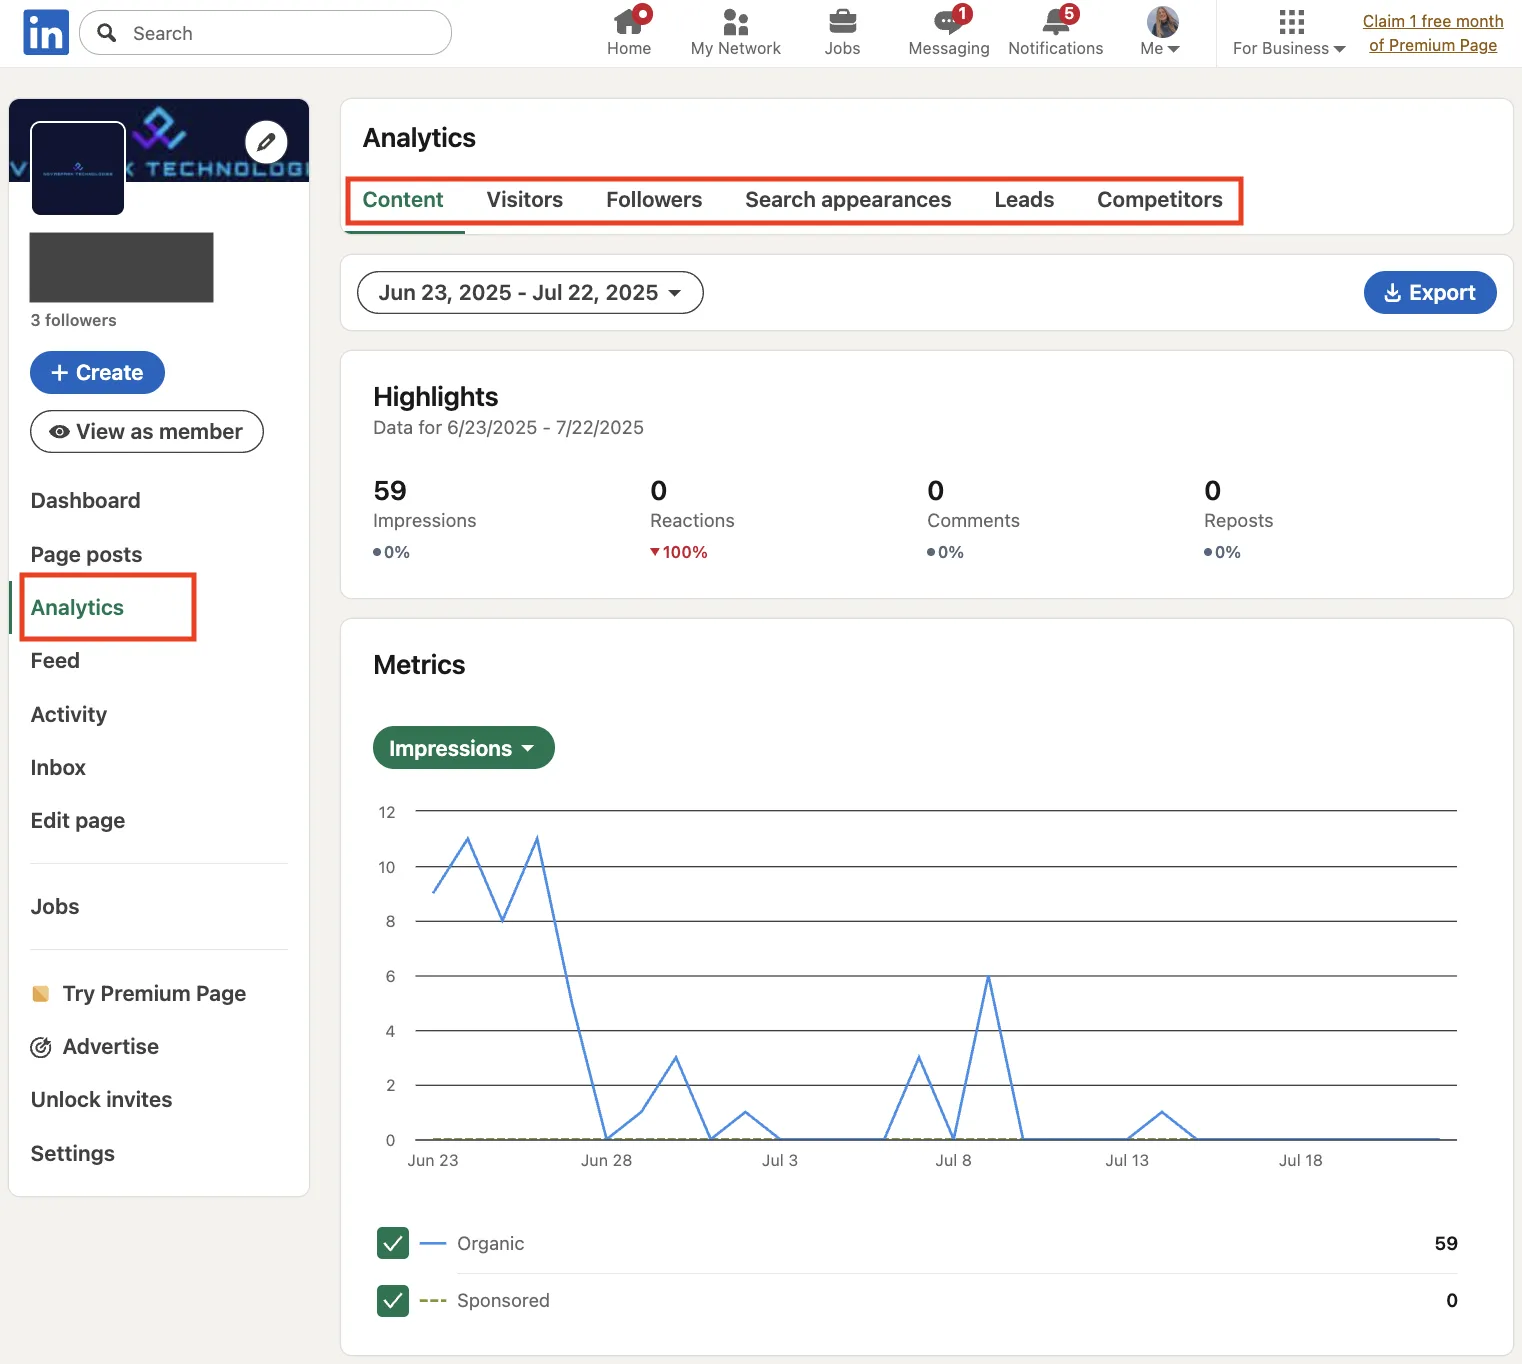
Company Page (organic)
- Switch to Admin view → Analytics → select Visitors, Followers, Content, or Competitors.
- Pick a date range, then click Export for an XLS file.
- Use Visitor demographics filters (location, job function, seniority, industry) to learn where content resonates most.
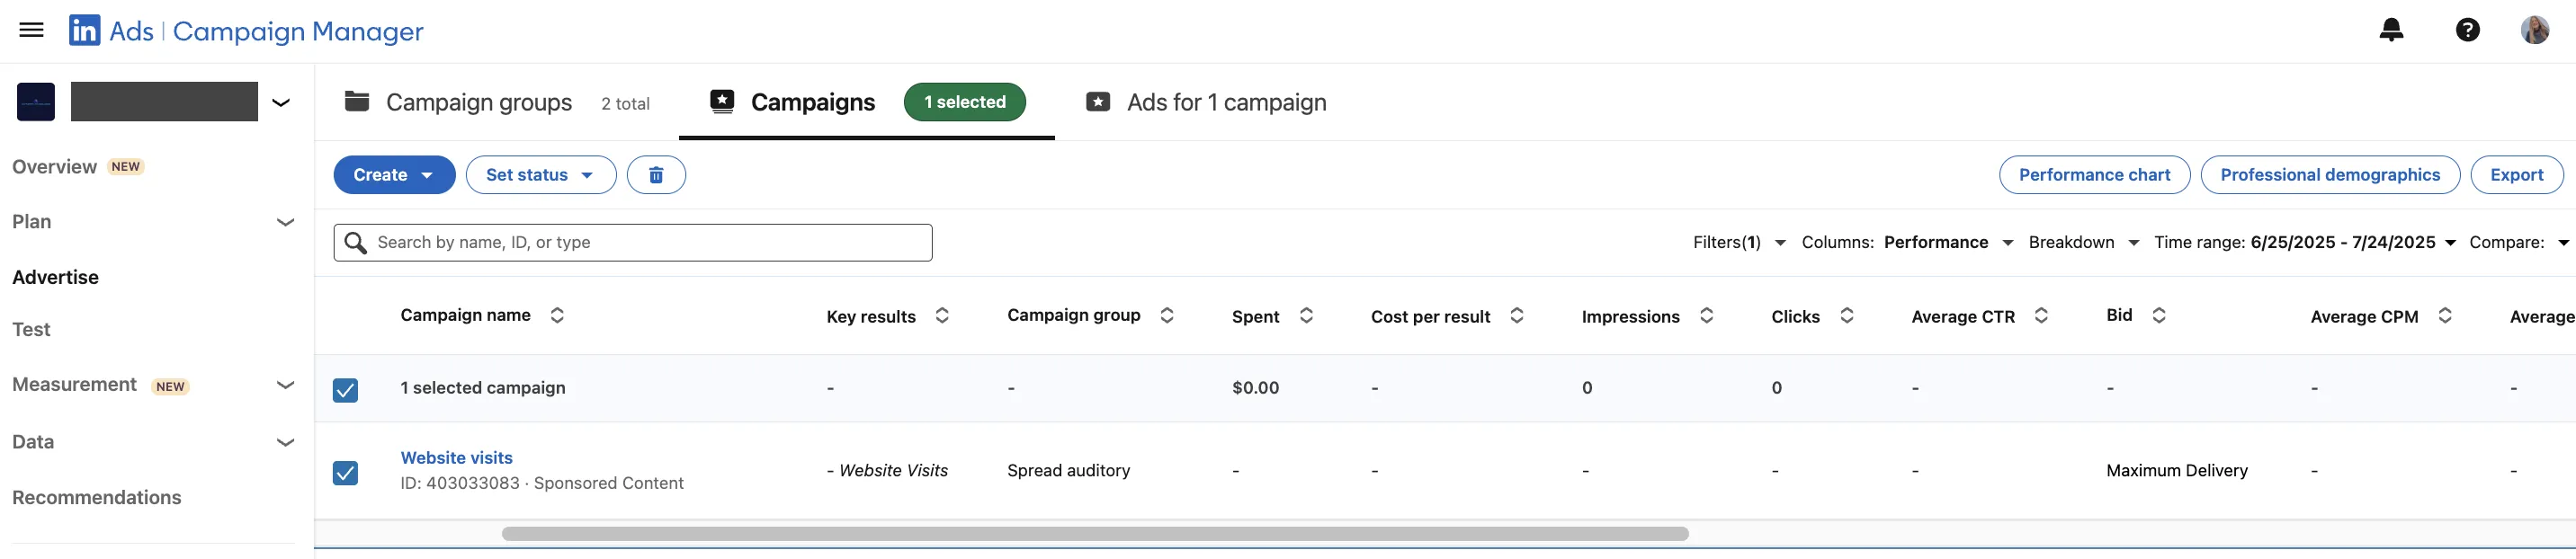
Campaign Manager (paid)
- Go to Campaign Manager → Advertise → select the Campaigns, Ad sets, or Ads tab (you can also view at the account or campaign group level).
- Open Columns to show Performance, Delivery, Engagement, Video, Conversions and leads, or Budget and bid.
- Use Breakdown → Impression Device Type for device data, and Professional Demographics for industry, seniority, or company size.
- Export CSVs; for certain reports (e.g., Conversion performance) you can choose daily, monthly, or all-time breakdowns.
What to Track
- Impressions
- Clicks
- CTR
- Engagement rate
- Follower gain
- Leads
- Conversions
- Cost per result
- Video completion rate
- Cost per conversion
- Impressions by device
Build Reusable Views
- Save custom column sets so every login shows only goal-driven metrics.
- Toggle Compare to measure current vs. previous period side by side.
For options beyond built-in reporting, see our list of LinkedIn analytics tools.
Best Practices
- Check Page dashboards every Monday for post-level tweaks; review full-funnel ads at month-end before reallocating spend.
- If engagement rate drops but impressions stay flat, experiment with document posts or carousels the following week.
- Spot rising CPC early: narrow targeting or refresh creative before costs snowball.
- Use demographic filters to validate whether ads reach the intended seniority or industry; adjust audience if misaligned.
- Export CSVs to BI tools for cross-channel dashboards and long-term storage (Page analytics retains up to 365 days; Ads data varies by report type).
- Keep stakeholder updates short: three insights plus one action, e.g., “Video view rate up 12%; double video budget.”
- Store every export. Year-over-year comparisons require historical data that LinkedIn may not retain.
- After major product launches, set up daily exports via third-party connectors (e.g., Coupler.io, Supermetrics) or schedule manual CSV pulls to monitor performance.
- Use Competitor analytics to compare your Page engagement against competitors (Premium Company Page required for tracking more than one competitor).
- Run a deep-dive analytics workshop once per quarter: combine the last three months of dashboards LinkedIn provides with CRM revenue data, then map which content themes produced the highest pipeline. This structured review keeps strategy aligned with actual results and prevents vanity-metric drift.
- Regularly exporting a LinkedIn report to your BI tool ensures continuity even if platform retention limits change.
These habits help you spot what is working and adjust spend before problems grow.
If you need more advice on optimizing your company page or growing your business presence, check our guide on how to manage a LinkedIn company page to get sales fast.
Bonus Tips
- Enable Conversion Tracking to unlock cost-per-conversion columns.
- Compare your engagement to competitors using Competitor analytics (see Best practices above for Premium limitations).
- Analyze daily performance trends in exports to identify optimal posting patterns; for hour-of-day insights, use external BI tools with UTM tracking.
- Tag UTM parameters in every ad; this links platform clicks to website behavior and closes attribution gaps.