
LinkedIn has over 1 billion members right now, so standing out is pretty tough.
To do it right, you need a good strategy. Nah. A killing strategy. And for this, you need reports from analytics tools. As the saying goes, “What is not measured can’t be improved.”
But, not all LinkedIn analytics tools are good. Some have tricky interfaces, others miss important features, and some just don’t give you the insights you want.
In this piece, find 8 solutions to make your LinkedIn better, along with use cases and pro tips.
TL;DR
- Best for LinkedIn outreach automation and analytics: Linked Helper
- Best for post-performance monitoring: SocialPilot
- Best for cross-account statistics: Taplio
- Best for a full social marketing strategy overview: Hootsuite
- Best for word usage analysis: Shield Analytics
- Best for real-time insights into LinkedIn profiles: Inlytics
- Best for basic LinkedIn metrics: LinkedIn Native Analytics
- Best for simplifying LinkedIn marketing data: Whatagraph
7 Criteria for Choosing a LinkedIn Analytics Tool
It all starts by setting criteria for your choice.
What’s your goal? Personal use or for a team? What kind of reports do you need? What kind of insights or automation do you hope to access? Here are the 7 criteria to consider:
1) Collaborative workflows
When working with a team, choose tools that let everyone collaborate easily.
Pick ones that allow multiple users, support real-time teamwork, and have features like commenting and collaborative editing.
Such features contribute to a more effective and coordinated team effort.
2) Analytics for cold outreach
To gauge your cold outreach effectiveness, use tools that show message performance — message open and response rates.
It helps you understand if your cold outreach is working and how to make it better.
3) Content and visitor analytics
A good analytics tool shows you which posts are popular and who likes them.
You can see who’s visiting your profile and what they do—do they just click on the post, open the link, like, comment, or share? It’s all here.
These insights highlight the best content, spot trends, and break down visitors’ behavior.
4) Data visualization
Go for tools that give you clear insights without drowning you in the sea of numbers.
Complicated data —> easy-to-read charts and graphs. This is how great analytics tool works.
If you can’t understand your progress at first (or at least second) glance, move on. Choose tools with a clear, actionable interface and insights.
5) Full funnel metrics tracking for LinkedIn Company Pages
If you manage a LinkedIn Company Page, you need tools with granular-level analytics—from the first interaction to conversion.
Full funnel metrics include tracking engagement, follower growth, post-performance, visitor insights, conversion monitoring, click-through rates, follower demographic data, and time spent on the page.
6) Detailed performance reporting
Standard social media analytics tools usually cover engagement and new followers. For more insights, you’ll need a tool with a thorough analysis.
Detailed performance reporting provides an in-depth analysis of the page/profile and each piece of content.
Such a report might also cover feedback and suggestions for better understanding.
7) Connection request’s acceptance rates
To track networking efforts, choose tools monitoring connection request acceptance rates.
You’ll see how well your networking is working and be able to refine your approach if needed.
8 Hand-Picked LinkedIn Analytics Tools
Now, taking into account all the criteria, let’s move to the practical side — a list of eight LinkedIn analytics tools.
Linked Helper — Best for LinkedIn outreach automation and analytics
Linked Helper changes the game for lead generation and sales outreach on the platform. Over 300,000 happy users worldwide and a solid 7-year track record prove its worth.
Core features:
1) Smart LinkedIn outreach automation:
- Automate personalized connection requests and messages via events, groups, and InMails
- Integration with popular CRMs like HubSpot and Pipedrive.
- Tools for both Basic and Premium LinkedIn, including Sales Navigator, Recruiter, Career, and Business.
- Warm up leads before or after the first touch by liking leads’ posts/articles, mentioning lead names under other posts, following leads, endorsing those who accepted the invitation, etc.
- Bulk messaging tool for enhanced group and event interactions (e.g., message to event attendees).
2) Multi-source targeting:
- Source leads from:
- SN lists, Saved searches, Recruiter Projects
- Posts on LinkedIn (collect those who liked or commented on any post)
- Followers (those who follow your LinkedIn account or a company account you’re an admin of)
- Who visited your profile page
- Upload profiles from CSV, TXT, and HTML files
- Advanced limits and working hours for customized daily activity.
- Bulk messaging tool for enhanced group interaction.
3) Scrape and export:
- Scrape and export almost all available information from profiles, including emails and phones.
- Export message history from LinkedIn or Sales Navigator inbox to CSV or third-party service.
- Connect to HubSpot, Pipedrive, or Close CRMs (and more to come) seamlessly via built-in integration.
- Is your CRM not on the list? Connect to any other CRM or tool like Google Sheets via webhooks using services like Zapier, Make, etc., for codeless integration.
4) Drip campaign experience:
- Build funnels with chains of messages for automated and controlled outreach.
- Hyper-personalization with standard and custom variables (add as many variables as you want — no limitation), personalized images, and smart message templates.
- Mix different steps in one workflow: in between the messages, clients can invite 1st-degree connections to a group or event, follow the organization, send them to the snov.io email campaign, etc.
- Instant 24/7 support. The team responds promptly within 10 minutes.
5) Linked Helper CRM:
- Put leads on autopilot with end-to-end workflows.
- Smart replies detection to ensure no wrongful automatic LinkedIn messages.
- Analyze profile and campaign analytics for strategic decision-making.
- Autotagging tool for effective tracking of profiles within campaigns.
Use cases
Here’s a rundown of the best ways you can use Linked Helper 2:
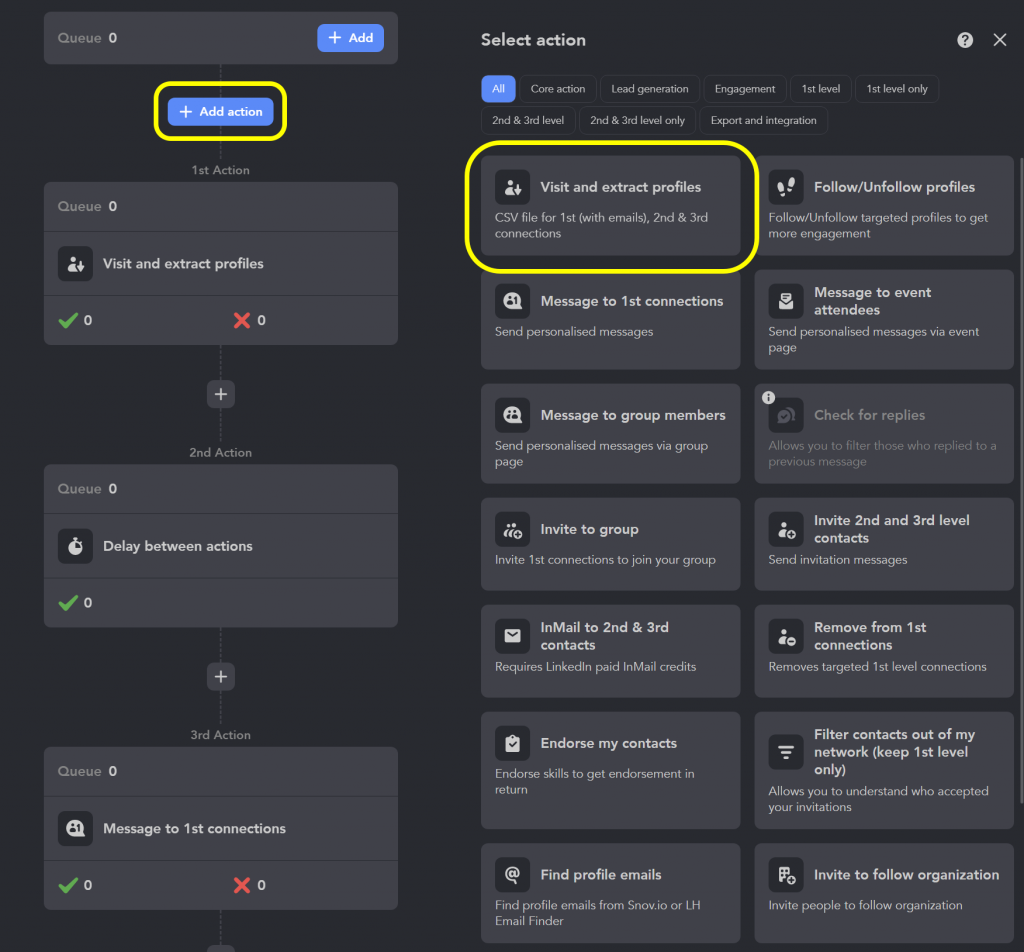
1. Profile analytics via scrapping
You can gather insights from different profiles by setting up a Visit and Extract campaign.
After visiting each profile, the robot copies the data. Use data from profile visits and CRM filters to refine your lead queue. Exclude poorly filled profiles, those without photos, or those with few followers.
Here’s how analyzing looks in practice:
- Arrange the table by the number of followers.
- Analyze competitors’ profiles for self-descriptions, headlines, and summaries.
- Use text analysis and gather top wording for your account.
- Scrutinize profiles for common words in texts and skills.
- Use these phrases in your texts to boost your LinkedIn presence.
- Find the link to the main profile photo in the spreadsheet.
- Analyze competitors’ photos for ideas and inspiration.
Pro tip: The result is a CSV file containing LinkedIn analytics, but you can easily import it into Excel.
2. Company page’s analytics via scrapping
Organizations Extractor lets you gather data about company pages, too.
Here’s how to analyze business data:
- View and analyze logos of companies in your market using direct links collected through Linked Helper.
- Easily collect links to competitors’ websites through a LinkedIn search.
- Access employee data to gauge the scale of organizations and understand your competitors’ growth.
- Evaluate the number of followers to set realistic growth goals.
- Extract company specialties from the file for use as keywords in your LinkedIn texts.

3. Scrape messaging history
If you’re currently running a campaign, Linked Helper automatically scrapes messaging history during message sending or reply checks.To collect messaging history from profiles not interacted with via Linked Helper, set up a campaign using the Scrape messaging history template.
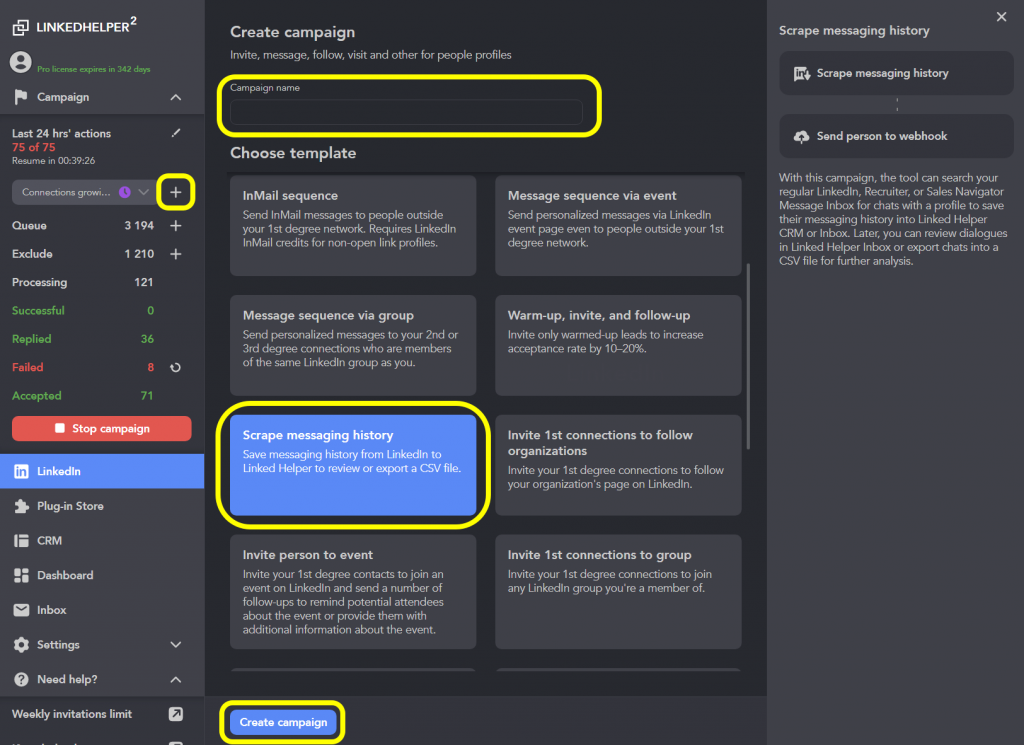
Linked Helper can scrape any chat on regular LinkedIn, Sales Navigator, or Recruiter, except chats with three or more participants.
Note: It doesn’t save attachments but notes the fact of sending or receiving them.
To check sent/replied messages, go to the Replied list in the Action/Campaign Workflow and review responses.
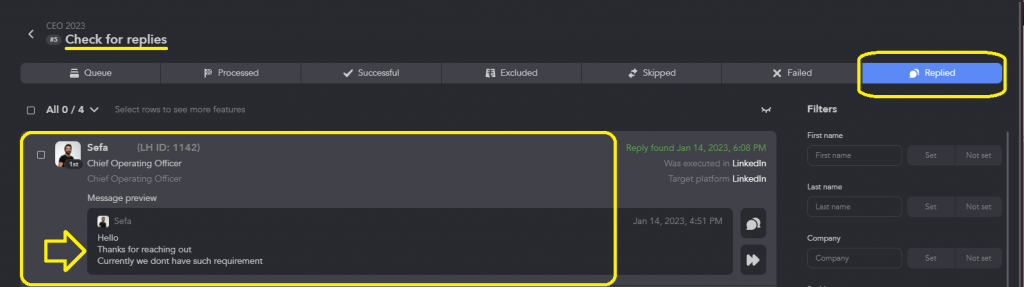
Pro tip: Always reply quickly, within 1-2 days, for better lead generation results. Check the replied list regularly and export responses using Send person to external CRM.
4. Streamline lead generation on new LinkedIn accounts
Linked Helper helps you find leads on a new LinkedIn account, whether it’s handed over or managed manually. Before automating, check previous interactions by extracting messaging history. Adjust your campaign or remove profiles if needed.Get a complete account overview with the Visit and Extract profiles function.
Linked Helper compiles all important company information available on LinkedIn. Thanks to that option, you can easily summarize profiles for in-depth Ideal Customer Profile (ICP) analysis.
Pro tip: Stick to one campaign, or when creating a new one, set stop words via filter by content plug-in for caution.
5. Track and analyze bulk invite acceptance rates
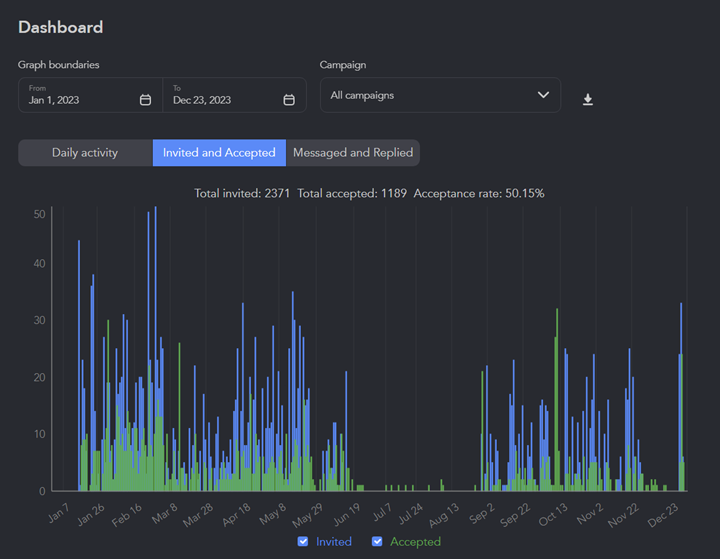
Track the acceptance rate of bulk invite requests using Linked Helper with 100-200 invitations per week.
Analyze the acceptance percentage with statistics provided during and after the campaign.
Pro tip: Use the “Action steps delays” plugin to set intervals for intermediate campaign steps — especially valuable in industries with finite potential leads.

6. Integration with Google Sheets
Simplify your profile management using Linked Helper with Google Sheets — a great fit for sellers looking to automate their business tasks.
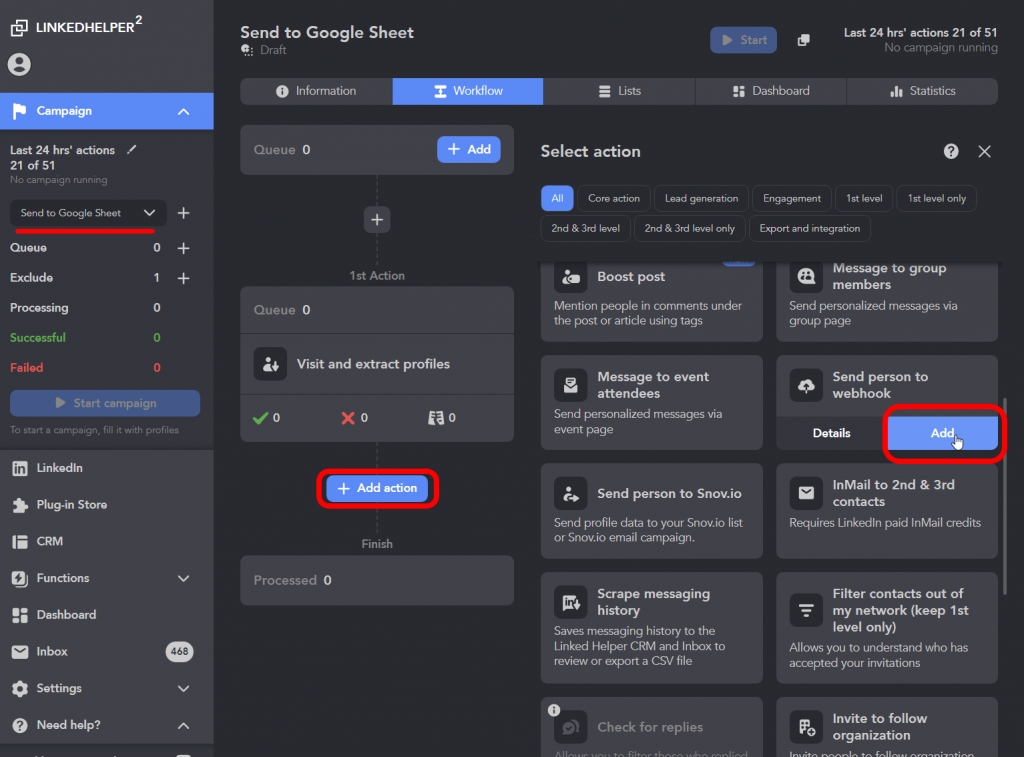
Pro tip: To continue Linked Helper sending data to a new sheet, change the original sheet name, create a new sheet, and set its name to ‘LH’ within the same document.
Pricing
- 14-day free trial
- Standard Plan: $15/month
- Pro Plan: $45/month
Save 11% with a 3-month plan, 33% with a 6-month plan, and 45% with a 12-month plan. Try Linked Helper now.
Download Linked Helper 2
and get 14-day free trial right now
DOWNLOADIf you are not yet in our list of users, then join.
We give you a trial version to start your experience with our LinkedIn tool.
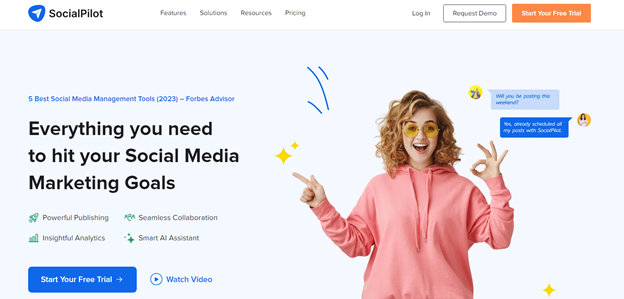
SocialPilot — Best for post-performance monitoring
SocialPilot is an all-in-one platform providing LinkedIn metrics with simple PDF reports.
You can see and download data for the last 7 days, 15 days, 1 month, and 3 months.
Core features:
- LinkedIn Management Tool for page analytics
- PDF downloads
- Follower growth analysis for trend monitoring
- Post-performance monitoring
- Engagement trends tracking
- LinkedIn growth comparison with advanced reports
- Shareable reports
- White label customization
Use cases:
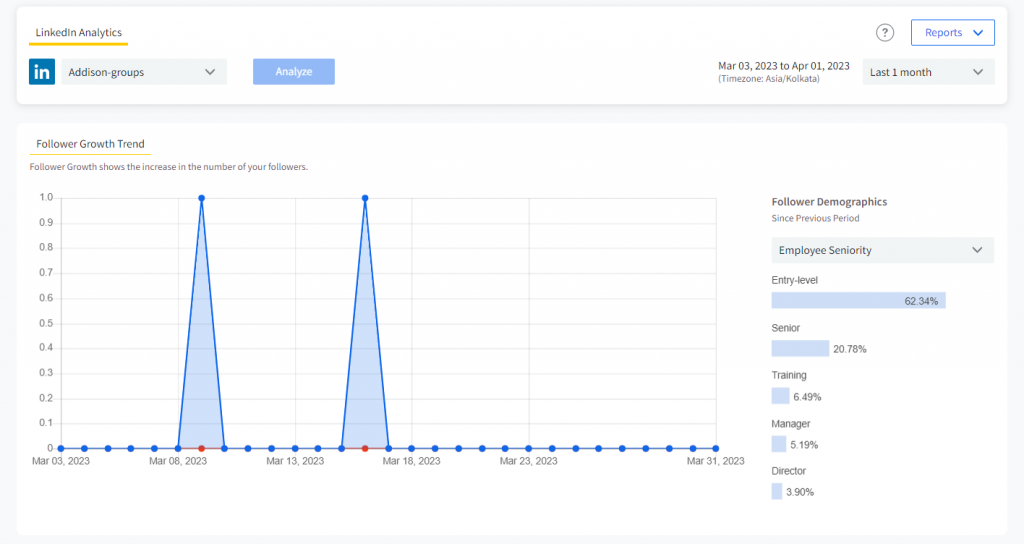
1) Use the Follower Count Trend feature to track and understand your followers better.
It breaks down for you:
- Employee level: Entry, Senior, Training, Manager, Director
- Company size: Big (10,001+), Medium (5,000-1,001), Small (500-1,000), Very Small (11-50)
- Functions: Engineering, Quality Assurance, Operations, Sales, HR
- Location: Top 5 follower locations
2) Post/Update Analytics keeps a tab on your top-performing posts. It covers all types of content — text, images, articles, videos, carousels, and even polls.
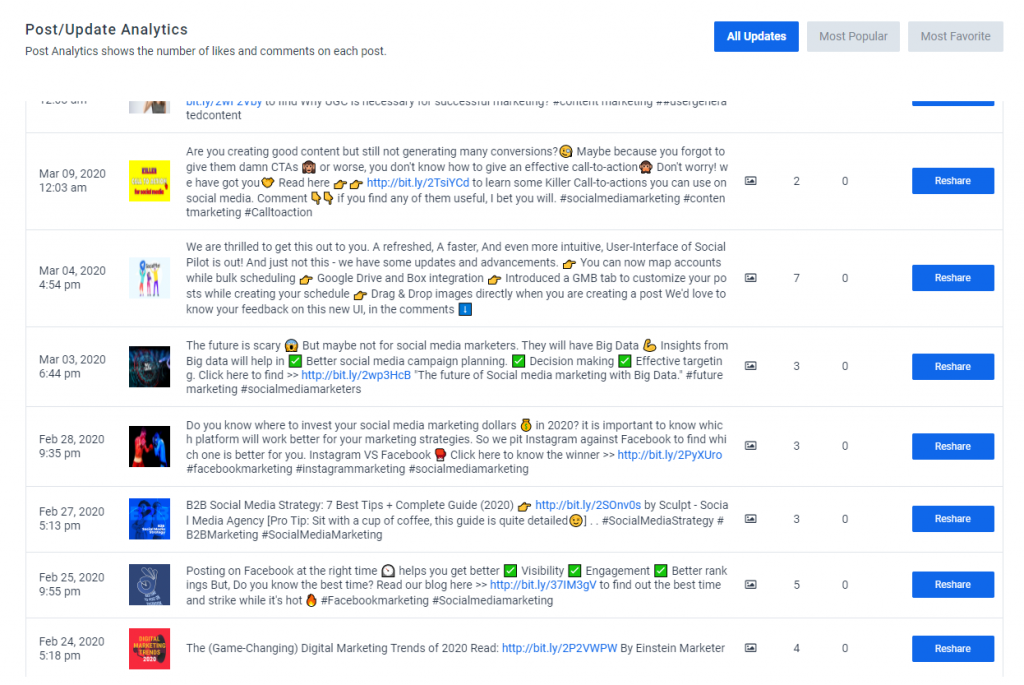
Pro tip: You can repost your best-performing content straight from the analytics tab.
Pricing:
- 14-day free trial
- Agency+: $150/month
- Agency: $75/month
- Small Team: $37.50/month
- Professional: $22.50/month
Taplio — Best for cross-account statistics
Taplio is an analytics tool for tracking progress, monitoring results, and gaining LinkedIn insights. Over 6,200 people trust it and use it every day. It also helps with lead generation and nurturing relationships.
Core features:
- Monitor your LinkedIn results
- Visualize your main KPIs in just one click
- Deep dive into each important metric
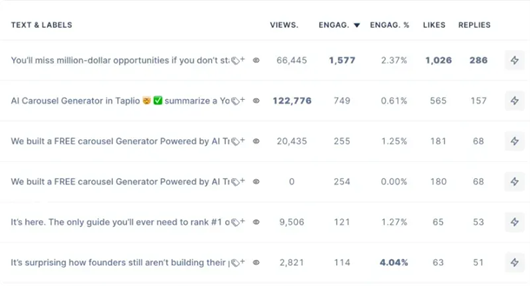
- Get detailed LinkedIn post-performance stats
- Cross-organization and team analytics
- Engage relationships
- Identify leads
- Weekly LinkedIn insights
- The Toolbox of free mini tools and content for LinkedIn
Use cases:
1) Taplio makes report creation easy with clear cross-account statistics and graphs.
This is especially beneficial for those managing LinkedIn on behalf of clients.
Reports also include:
- Individual post analytics.
- Team-level and account-level aggregate views.
- Main KPIs (engagement, followers, reach, etc.)
2) Turn post engagement into dedicated supporters and subscribers.
Gather people engaging with your posts, connect with competitors’ audiences, and easily import contacts from Sales Navigator. Improve outreach by commenting on recent posts or acquiring email addresses.
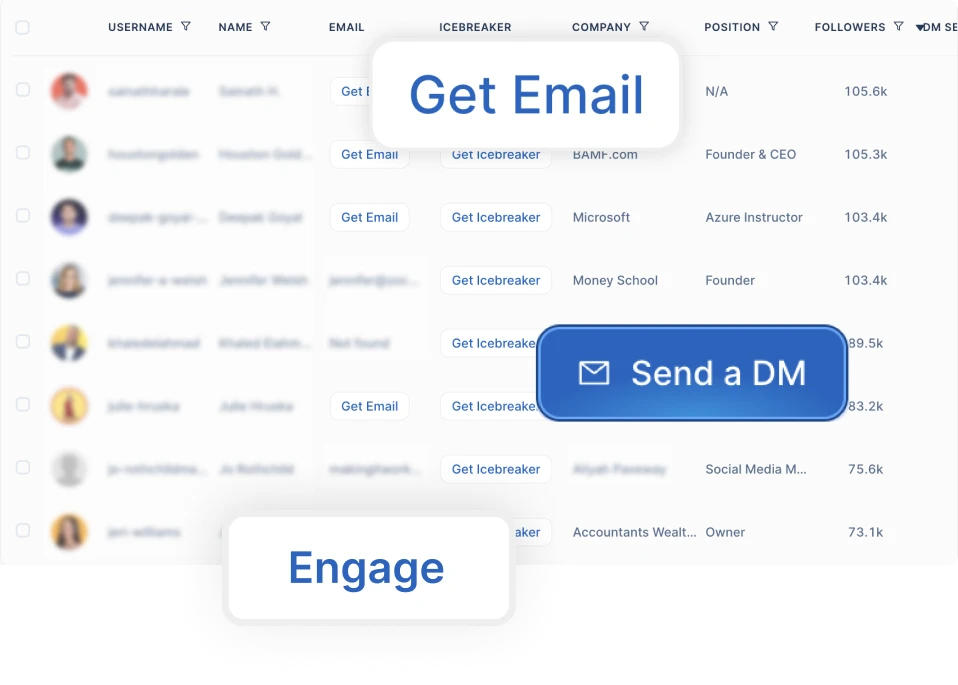
Pro tip: Integrate these connections into lemlist campaigns or other tools like Zapier for wider reach.
Pricing:
- 7-day free trial
- Starter: $39/month
- Standard: $52/month
- Pro: $149/month
Hootsuite — Best for a full social marketing strategy overview
Hootsuite is one of the most popular social media management tools. It provides detailed analytics for all social media platforms, including LinkedIn. You can easily track your business page and profile performance, compare stats, and receive real-time brand mention alerts.
Core features:
- Track content performance
- Instant brand alerts
- Detailed metrics
- LinkedIn ad campaign performance
- Competitor insights
- Customizable reports
- Overview, audience, engagement, and hashtag analytics
- Cross-platform performance
- Scheduling
Use cases:
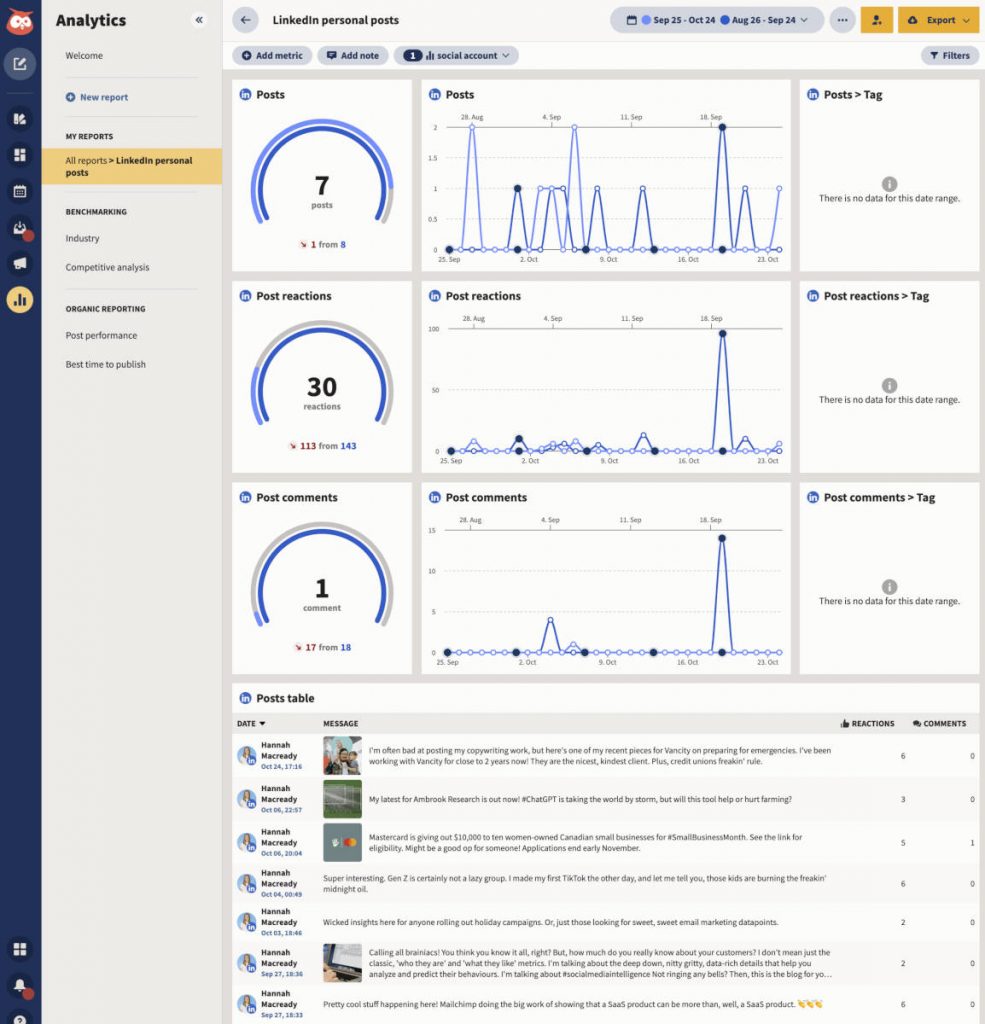
1) LinkedIn post-level metrics monitor your posts and their engagement, while the Top posts section highlights the best-performing content. Post clicks represent interactions by signed-in members, and the Engagement rate shows the percentage of clicks, likes, comments, or shares. Other metrics include post impressions, Ow.ly link clicks, time watched, and video views.
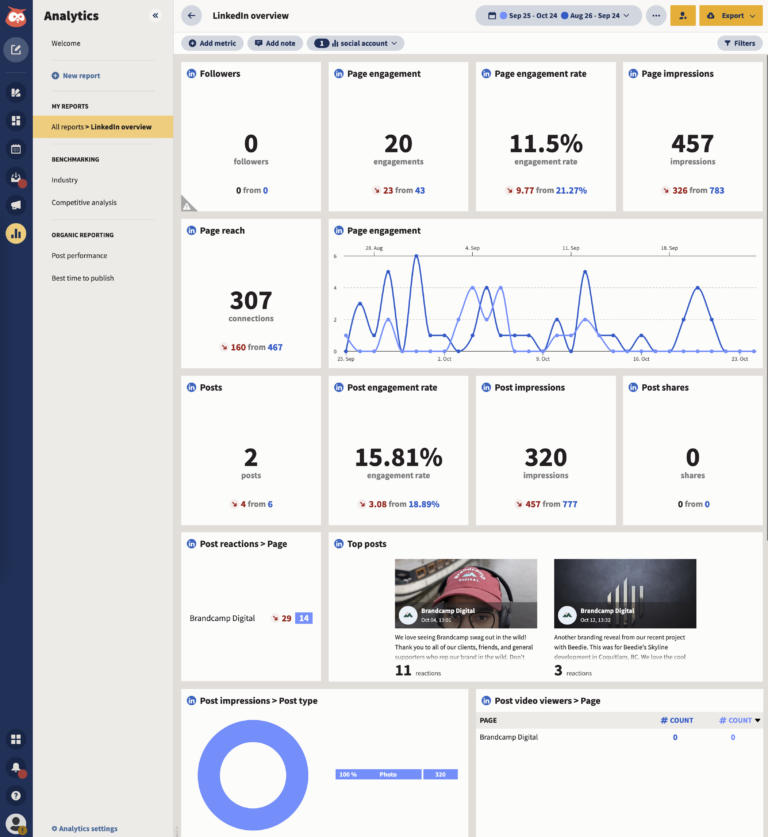
2) LinkedIn Page-level metrics cover all posts in a specific timeframe you choose.
It displays:
- Times people clicked, reacted, and shared your posts.
- A number of comments.
- Percentage of people engaging with your posts.
- Number of new followers or unfollowers, including from paid promotions.
- Number of LinkedIn users who saw your posts.
- Total number of posts published.
Pro tip: Compare your LinkedIn reports with other social networks to get a complete view of your marketing efforts.
Pricing:
- 30-day free trial
- Professional: $99/month
- Team: $249/month
- Enterprise: Custom pricing
Shield Analytics — Best for word usage analysis
Since 2019, Shield Analytics has transformed LinkedIn analytics for corporate creators and their teams. It’s trusted by brands worldwide and hailed by pros like Justin Welsh, Maria Malik, and Jason Vana for its impact on post-performance and brand growth.
Core features:
- Visual growth insights
- Top-performing posts identification
- Word usage analysis
- Consistency monitoring
- Team collaboration tools
- Organic content value measurement
- Centralized dashboard access
Use cases:
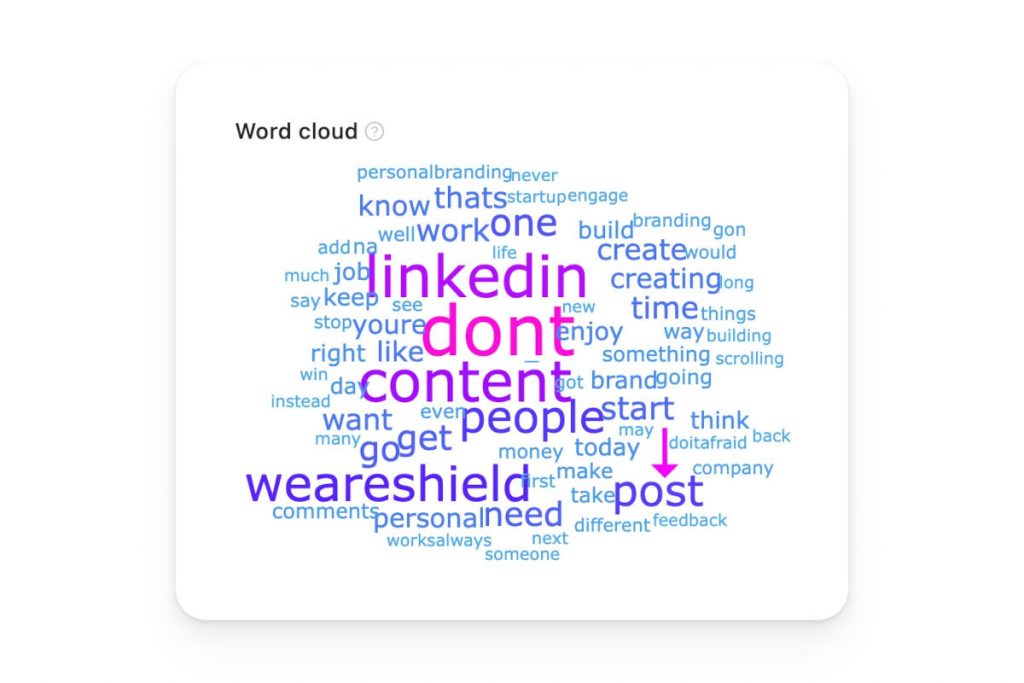
1) Word cloud offers a visual breakdown of your most frequently used words and reveals the key topics in your LinkedIn content. Thanks to this feature, you can refine your social media strategy to focus on what resonates most with your audience.
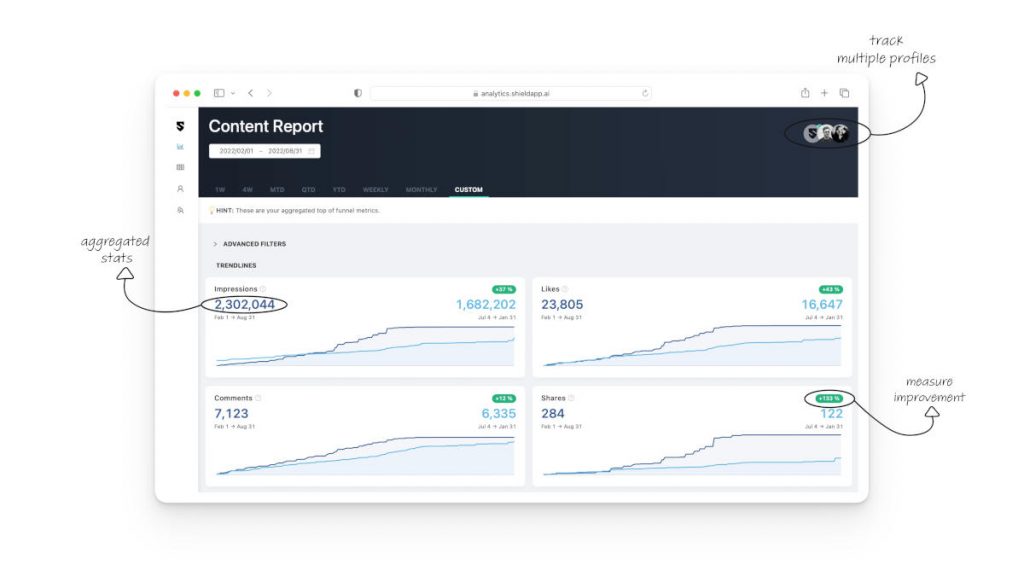
2) When you link your LinkedIn account to Shield, you get valuable insights not just from the present but also from your entire post history.
From day #1 till now. These data-driven results reflect how much your LinkedIn activity is paying off and how good your progress is.
Pricing:
- 10-day free trial
- Starter: $6/month
- Creator: $12/month
- Influencer: $19/month
Inlytics — Best for real-time insights into LinkedIn profiles
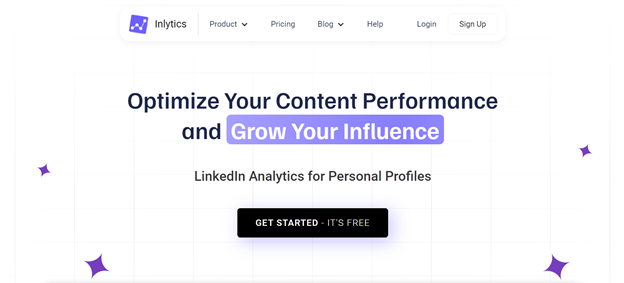
Inlytics provides real-time insights into LinkedIn profiles and content performance. It explores metrics, tracks trends, and helps understand followers’ behavior. But unlike some other tools, Inlytics is made with personal profiles in mind. You can’t use it for company page analytics.
Core features:
- Dashboard with five key metrics for quick insights
- Detailed content metrics
- Historical insights on impressions, reactions, comments, and engagement rate
- Visual timeline and content table
- Enhanced profile stats with six key metrics
- Insights on profile views, connections, and followers
- Visual charts for quick trend identification
Use cases:
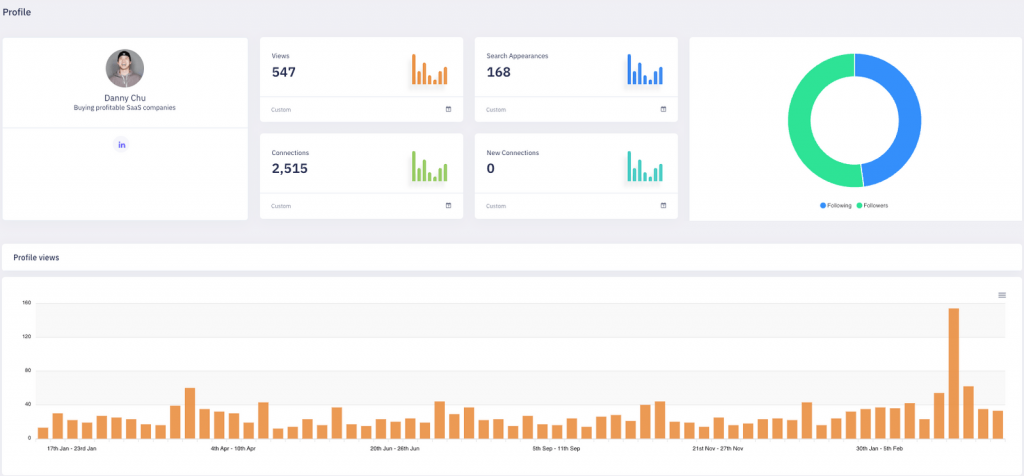
1) Enhanced Profile Stats feature shows the number of new connections added in the last 90 days and keeps tabs on the follower count. The dashboard displays all changes in chronological order, providing a clear and precise timeline.
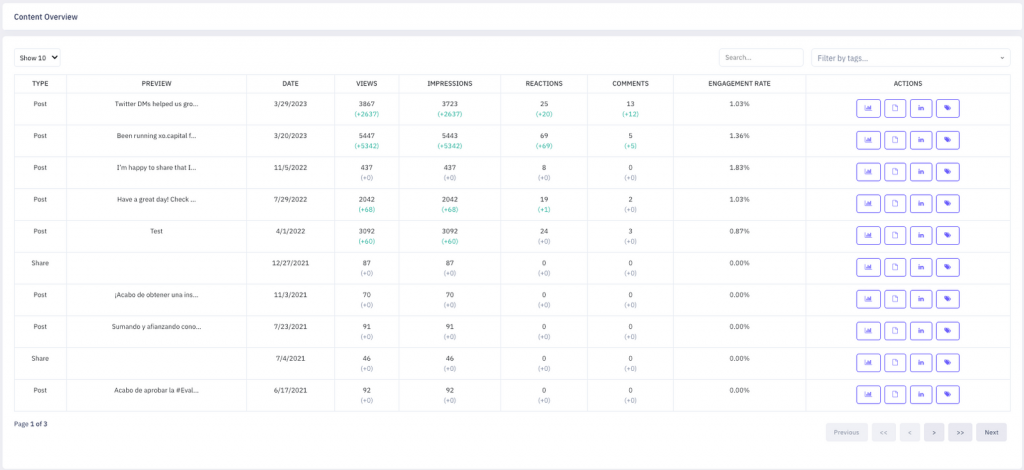
2) Inlytics’ Content Performance offers six detailed content metrics.
Track the development of post impressions over time, understand changes in reactions relative to impressions, and correlate comments with a wave chart.
Monitor post performance with the engagement rate, visualize peak engagement times with the timeline content table and gain per-post insights from a clear, colored table in the content overview.
Pro tip: Inlytics lets you compare your performance with other industry leaders, helping define your competitive potential.
Pricing:
- Free: 30 days of data storage
- Essential: $125/year
- Complete: $200/year
LinkedIn Native Analytics — Best for basic LinkedIn metrics
LinkedIn Native Analytics is an in-built tool available to all Page admins. It measures how your page is doing, including audience engagement and content effectiveness. LinkedIn also offers analytics for personal profiles.
And if you’re wondering why some people choose other tools, it’s because this one offers pretty basic analytics. Unlike tools such as Linked Helper, it doesn’t track message performance and doesn’t offer in-depth image insights. Doesn’t offer message personalization with variables.
Core features:
- Visitor insights
- Follower tracking
- Content performance
- Lead monitoring
- Competitor benchmarking
- Employee engagement
- Post metrics
- Newsletter analytics
Use cases:
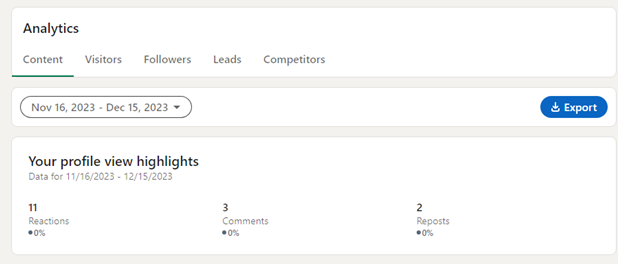
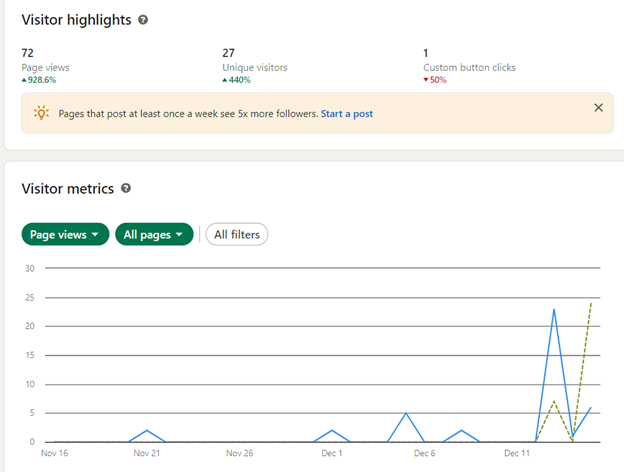
1) Use Visitor Analytics to track your social media performance and get details into:
- Total views, unique visitors, and button clicks in the last 30 days (with a percentage change).
- Key traffic details, filterable by time, sections, views, and unique visitors (available in aggregate and non-aggregate forms).
- Audience breakdown by time, job function, location, seniority, industry, and company size (shown as a percentage of total unique visitors).
- Visits and unique visitors to your life Pages with filtering options for time, published pages, unpublished pages, or all pages.
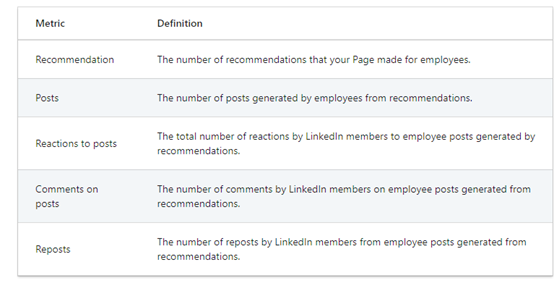
2) Employee Advocacy Analytics reveals how employees interact with suggested content.
The intuitive LinkedIn dashboard displays a few key metrics — posts, recommendations made, comments/reactions on employee posts, and reposts.
Pro tip: Improve those results by fostering active employee engagement in the program.
Pricing:
- Free
- LinkedIn Premium (prices vary based on a plan)
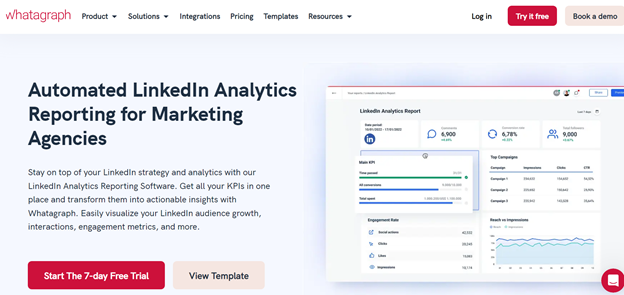
Whatagraph — Best for customizable LinkedIn marketing reports
Whatagraph is a popular social media marketing tool among agencies and in-house teams. It tracks LinkedIn metrics in the platform, automates KPIs, and collects audience, page, post, and engagement insights.
Core features:
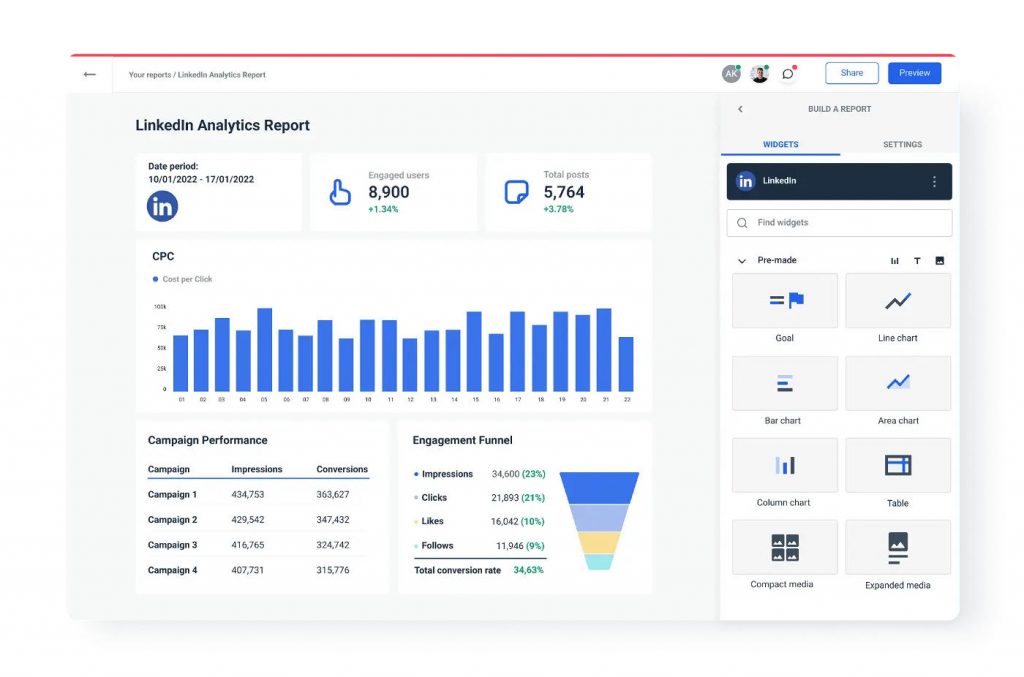
- Track LinkedIn strategy and KPIs
- Automated reporting software
- Pre-made widgets
- Google Analytics reports with just a few clicks
- 45+ data sources for a comprehensive dashboard
- Combine cross-channel data intuitively
- Schedule and share reports
- White-label reports for a branded look
Use cases:
1) Whatagraph’s report covers every detail of your audience and traffic.
Learn about their industry, professional interests, location, gender, and average age range.
And in just a few clicks, you can share all these reports with your whole team.
It’s also possible to export and migrate LinkedIn data to Google Sheets without the hassle of manual entry.
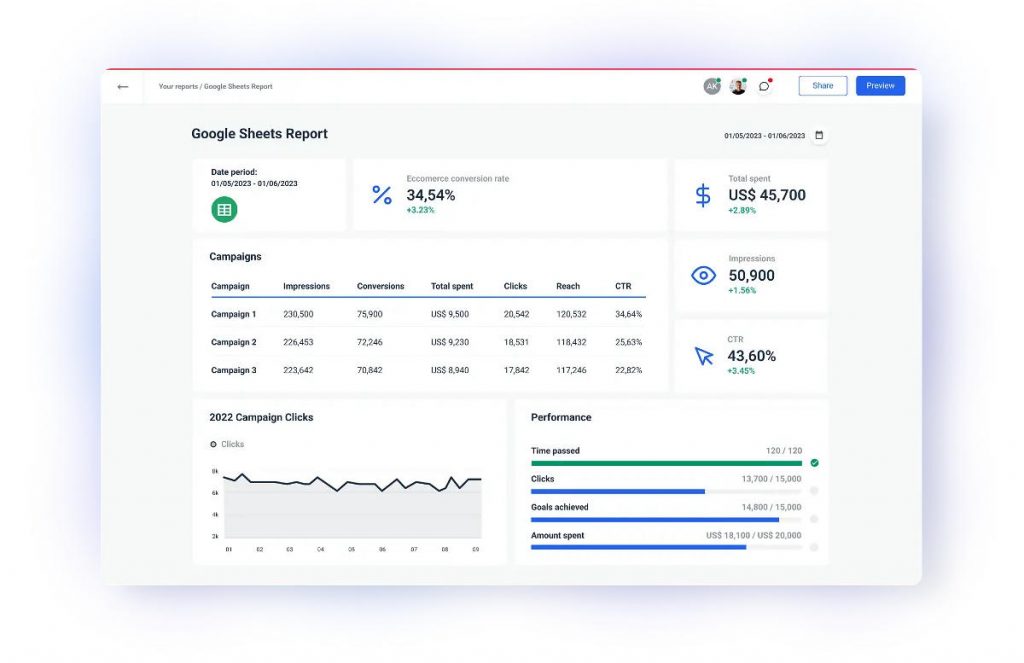
2) Full report automation collects performance data for all KPIs and schedules reports at desired intervals.
You can easily share a live link and provide your clients with instant access to updates whenever needed.
Pro tip: Customize your reports—add your logo and use colors and visuals. Create from scratch or pick templates.
Pricing:
- 7-day Free Trial
- Professional: $223/month (billed annually)
- Premium: $335/month (billed annually)
Custom: Custom pricing (billed annually or quarterly)
FAQs
1. What is the free tool to analyze LinkedIn?
LinkedIn Native Analytics is a free tool to get an overview of your page and profile performance. Gain insights into audience engagement, content effectiveness, visitor stats, follower tracking, lead monitoring, competitor benchmarking, employee engagement, and newsletter analytics.
2. What is the top LinkedIn analytics tool for 2024?
Linked Helper is the best choice because it’s perfect for analytics, lead generation, and outreach. Multi-source targeting, scraping, drip campaigns, and its own CRM. It’s versatile and user-friendly and helps customers with in-depth profile and company page analytics.
3. What are the most important LinkedIn analytics reports?
- Profile and company page analytics
- Outreach analytics
- Messaging history
- The acceptance rate of bulk invites
- Content strategy analytics
- Followers/visitors metrics
- Impression/engagement metrics