
 Updated: October 3, 2026
 22 min read
For cold LinkedIn outreach, about 28% connection acceptance is a useful starting reference. For replies, compare like with like: HeyReach reports an 18% median reply rate among accepted connections, while Reachium reports 27.55% across its accepted contacts. Our recommendation is to track replies per accepted connection to assess the conversation stage, and qualified replies and meetings per invitation to judge the campaign's business value.
The benchmarks below use data from 2025–2026; the 2027 section explains what to carry into your next planning cycle. Each rate names its denominator so you can choose the right comparison. These are third-party findings reviewed for the Linked Helper blog, rather than Linked Helper customer results.
LinkedIn Outreach Benchmarks for 2027 Campaign Planning
| Metric | Result | Method | Source |
|---|---|---|---|
| Connection acceptance | 28.5% | Accepted / invitations sent; pooled by request volume | Expandi |
| Connection acceptance | 27.11% | Accepted / invitations sent; pooled, requests aged at least 30 days | Reachium |
| Connection acceptance | 21% | Median sender's acceptance rate | GetSales, presented in Extrovert's webinar recap |
| Replies per accepted connection | 18% | Median campaign rate | HeyReach |
| Replies per accepted connection | 27.55% | Accepted contacts with a reply / accepted contacts; pooled | Reachium |
| Replies per invitation sent | 7.47% | Same replying contacts / invitations sent | Reachium |
| Replies per outbound message | 10.4% | Replies / outbound messages, including follow-ups and multiple channels | Expandi |
| Booked meetings per accepted connection | 1.99% | Accepted contacts with a tracked booking / accepted contacts | Reachium |
| Booked meetings per invitation sent | 0.54% | Same contacts with a booking / invitations sent | Reachium |
Expandi measured 13,218,869 invitations from 13,302 accounts during May 2025–April 2026.
Reachium's Aug 6, 2026 extraction covers activity from Jan 8, 2025 onward; its headline cohort excludes invitations sent in the final 30 days, leaving 180,155 requests.
GetSales reports 6M+ invitations across 20,000+ accounts in Q2 2026.
HeyReach reports 96,051 campaigns; its article does not give calendar dates for the measurement window.
Use the studies as separate reference points: their customers and aggregation methods differ. Sources are linked beside the figures.
How to compare your campaign with these benchmarks
Start with one campaign and one group of invited contacts. Record the invitation dates, the date you measured outcomes, the audience and the sender. Keep those contacts together as you count acceptances, replies, and bookings.
1. Calculate four rates from the same contacts
Let S be successfully sent invitations, A accepted contacts from that group, R accepted contacts who sent at least one reply, and B accepted contacts with a booked meeting. Count each person once at each stage.
| Metric | Formula | What it tells you |
|---|---|---|
| Acceptance rate | A / S × 100 | How many invited contacts connected |
| Reply rate per accepted connection | R / A × 100 | How many accepted contacts replied |
| Reply rate per invitation | R / S × 100 | How many original invitations led to a replying connection |
| Meeting rate per invitation | B / S × 100 | How many original invitations led to a booked meeting |
Suppose a campaign sent 500 invitations, received 140 acceptances, had 35 unique accepted contacts reply, and recorded bookings with 4 of those contacts. Its rates are:
-
28% acceptance: 140 / 500.
-
25% replies per accepted connection: 35 / 140.
-
7% replies per invitation: 35 / 500.
-
0.8% meetings per invitation: 4 / 500.
This is an illustrative calculation, not a Linked Helper customer result or a forecast.
The 25% and 7% figures are both correct. A campaign report should say which one it uses. Record a zero denominator as “not available,” rather than as a 0% conversion rate.
There is one extra distinction for connection notes. LinkedIn allows recipients to reply to an invitation note without accepting the connection.
The formulas above follow an accepted-contact funnel. Keep replies from people who have not accepted in a separate count.
You can also calculate replies from all invited contacts / invitations sent, but label it explicitly before comparing it with a source that counts replies only among accepted contacts.
2. Give each group enough time to produce an outcome
An invitation sent yesterday and one sent a month ago have had different opportunities to convert. Choose a measurement rule and retain it between comparisons:
Minimum-age snapshot
Include only invitations at least 30 days old, and count their outcomes through the extraction date. Older invitations still have longer observation periods.
Fixed observation window Count outcomes within the first 30 days after each invitation. This gives each contact the same follow-up duration, but requires usable event dates.
For either method, filter the entire cohort: acceptances and replies must belong to the invitations included in the denominator. A calendar month's replies may include people invited in an earlier month.
3. Use the comparison to choose what to investigate
| What you observe against your own comparable campaigns | What to check next |
|---|---|
| Fewer invitations turn into connections | Audience selection, sender profile, invitation context, and observation time |
| Acceptance is similar, but fewer accepted contacts reply | Audience–offer fit, message relevance, delivery, and follow-up coverage |
| Replies increase, but interested conversations do not | The content of replies; whether the campaign attracts declines or clarification requests |
| Interested conversations increase, but bookings do not | Qualification, the next-step request, scheduling and missing booking records |
Change the part of the funnel that needs attention, then compare the next campaign with the previous one using the same audience criteria and observation window. Test one major change at a time so the result tells you what to keep.
LinkedIn connection acceptance rate benchmarks
What is a good LinkedIn acceptance rate?
Our take: around 28% acceptance is a reasonable starting reference for cold outreach, because Reachium and Expandi report pooled rates of 27.11% and 28.5%. Treat a result near those figures as a healthy first-stage signal when it also produces relevant conversations. If acceptance is lower, review your sender profile, audience and invitation context before increasing volume. Use a closely matched segment when one is available.
GetSales reports a 21% median sender acceptance rate. That describes the sender in the middle of its distribution. A pooled rate divides all acceptances by all invitations, so high-volume senders carry more weight; a median gives each sender one place in the distribution. For a team comparison, match the aggregation method as well as the audience.
For a team report, you may want to see the pooled rate and the median sender rate, with each sender's invitation count. This makes it easier to see whether a large campaign dominates the overall result.
Linked Helper workflow: qualify the invitation list
If your acceptance rate falls below a comparable benchmark, start with audience fit. In Linked Helper, collect prospects from relevant searches, company employees, events or post interactions, remove duplicates, and keep each source identifiable.
Use AI ICP Detection to assess profiles against your customer criteria and set a minimum match score before invitations. Review a sample of both accepted and rejected profiles; the score reflects fit with your criteria. Select the profile fields and data freshness needed for that assessment.
Measure unique qualified leads per source, data coverage, and accepted / sent invitations by segment. These are workflows to test; the benchmark studies do not establish a Linked Helper-specific lift.
How long do LinkedIn connection requests take to be accepted?
Reachium's analysis (January 2025–August 2026) showed median time to acceptance was 25.4 hours; 46.7% of acceptances happened within a day and 92% within 30 days. Those percentages are shares of accepted requests with usable timestamps (total: 53,142), not shares of everything sent. Acceptance timing study.
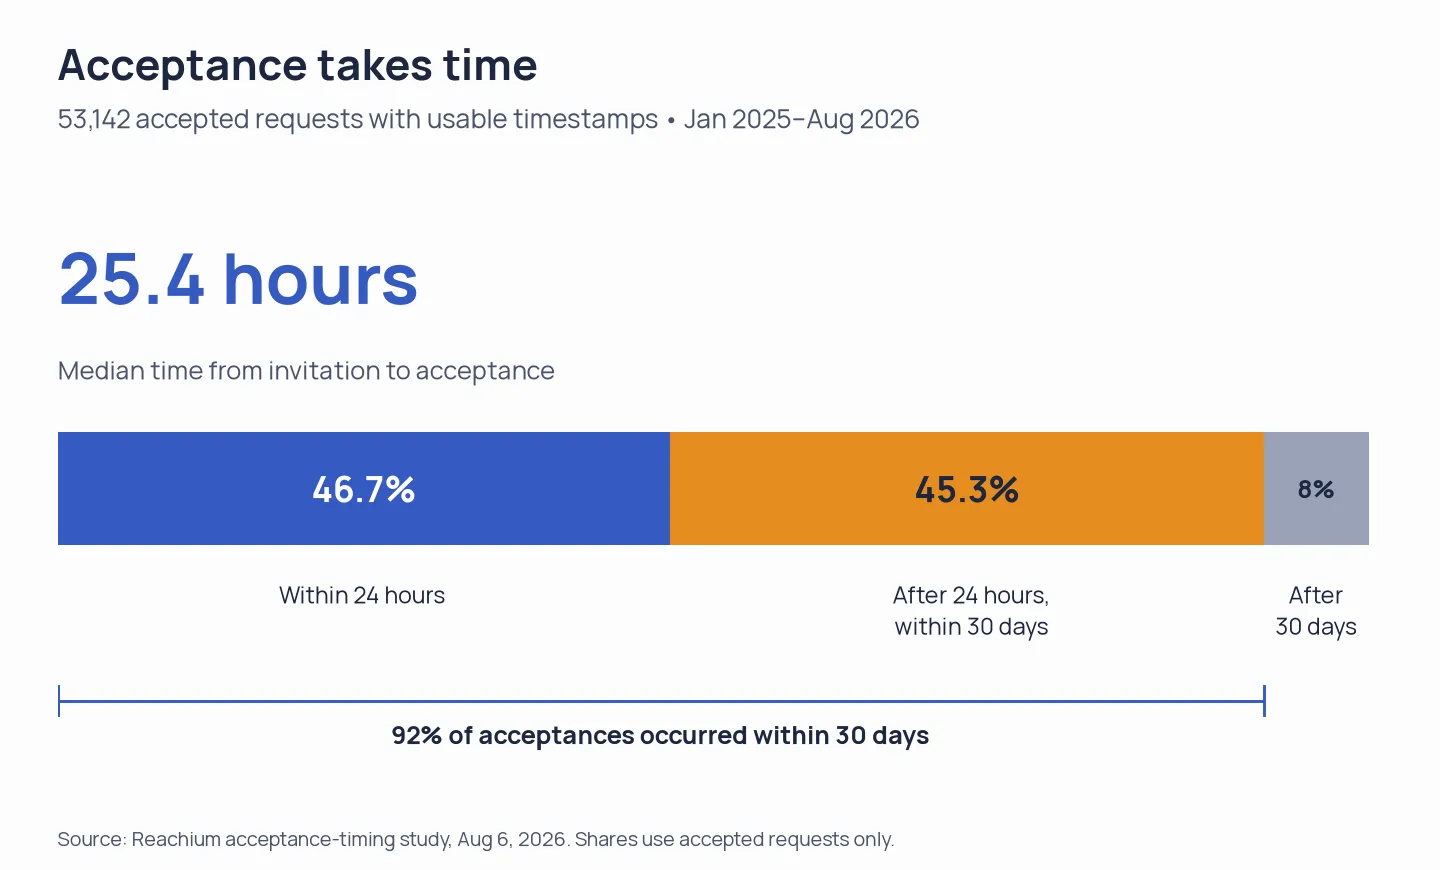
Of requests that were accepted and had valid timestamps, 46.7% were accepted within a day and 92% within 30 days. Pending invitations need time before you assess their outcome.
Use a 30-day checkpoint for your first comparison rather than judging invitations after a few days. Keep pending requests separate from confirmed declines: some contacts accept later, and a pending request does not reveal why they have not acted.
Linked Helper workflow: test engagement before inviting
If the audience looks suitable but invitations are still ignored, test whether prior familiarity helps. Linked Helper can place profile visits, follows or recent-post engagement before the invitation. Choose relevant interactions and review AI-generated comments before approving them.
Compare one engagement approach with an otherwise similar invitation-only group. Keep the sender, audience criteria, invitation copy and observation window consistent. Measure accepted / sent invitations at the same 30-day checkpoint, then check qualified replies per invitation. More acceptances are useful only when the additional connections fit your offer.
LinkedIn reply and meeting rate benchmarks
What is a good LinkedIn reply rate?
Our take: 18% replies per accepted connection is a useful starting checkpoint for cold outreach, because it is the median across HeyReach's 96,051 campaigns. Reaching or exceeding it puts you at or above the middle campaign in that study; falling below it is a reason to review the offer, message relevance and follow-up coverage. Reachium's 27.55% pooled figure is a separate reference, not an upper boundary. We would judge a campaign successful only when replies include interested prospects and lead to worthwhile meetings.
Reachium's full funnel shows why the denominator matters. The same 13,456 replying contacts equal 27.55% of accepted connections and 7.47% of invitations sent. In the table below, every share is calculated from invitations sent:
| Stage | Total | Share |
|---|---|---|
| Invitations sent | 180,155 | 100% |
| Accepted contacts | 48,836 | 27.11% |
| Accepted contacts with at least one reply | 13,456 | 7.47% |
| Accepted contacts with a tracked meeting booking | 973 | 0.54% |
Source: Reachium's matured cohort.
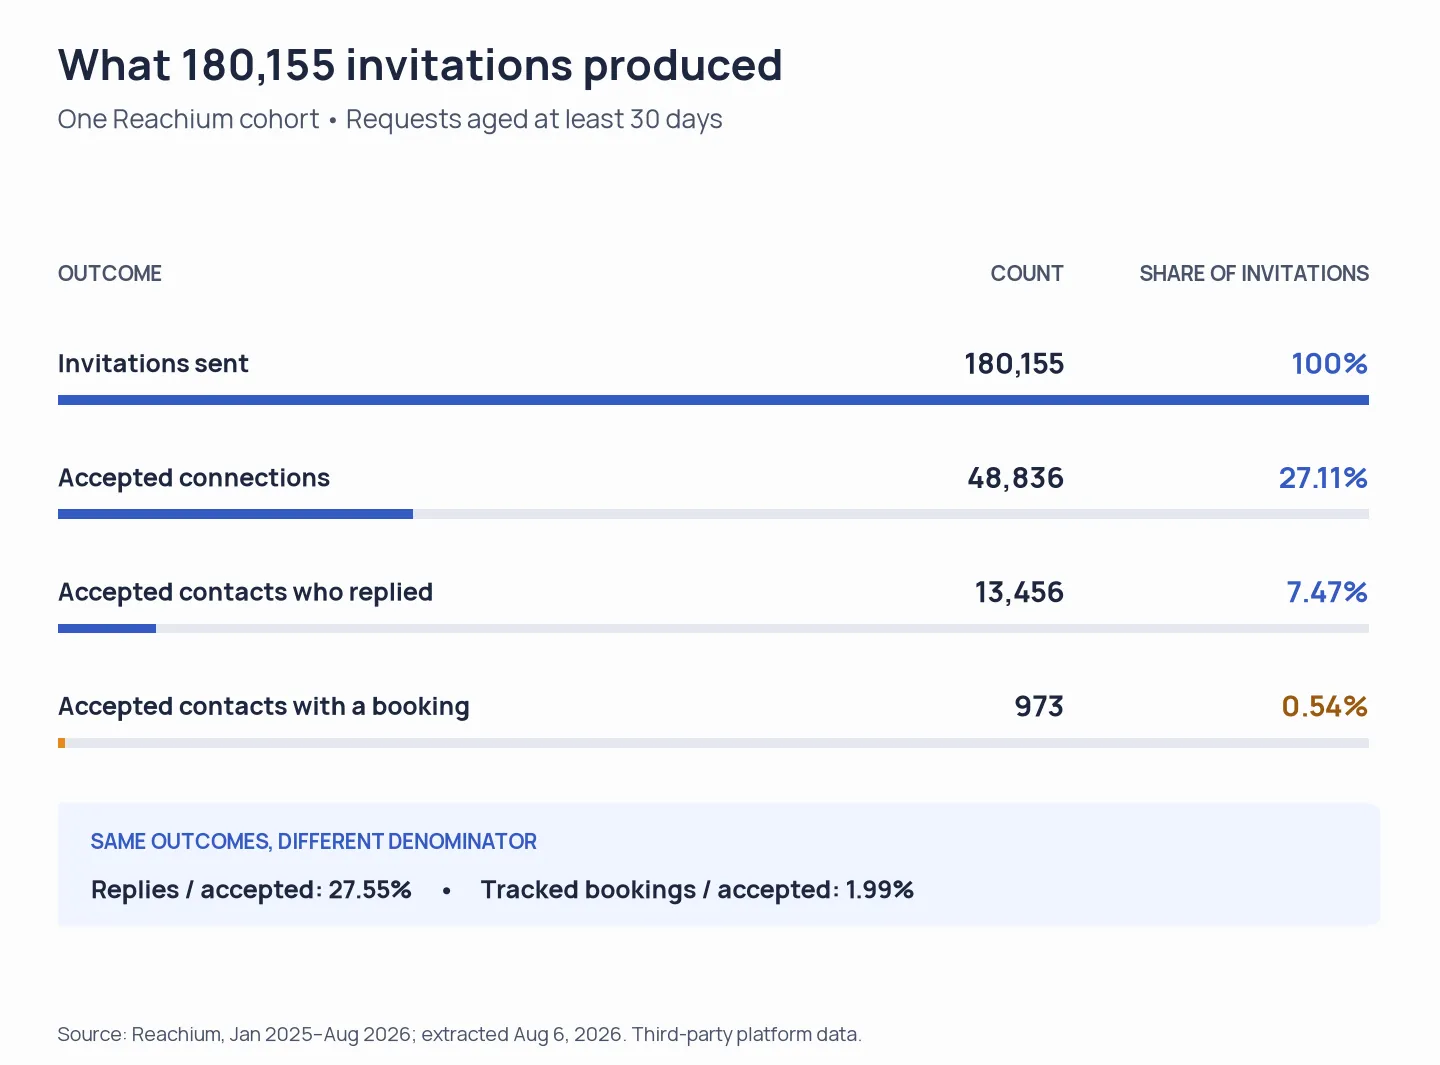
The same cohort produces different rates depending on the denominator: replies are 27.55% of accepted connections or 7.47% of invitations sent. Meetings are 0.54% of invitations.
Replies include negative responses; bookings made outside the tracked workflow may be missed.
Why message reply rate cannot complete this funnel
Expandi's 10.4% message reply rate divides 700,868 replies by 6,730,447 outbound messages. That pool includes follow-ups, group and event messages, InMails and emails. It measures replies per message, rather than replies per unique accepted connection.
Multiplying a 28.5% acceptance rate by that 10.4% message rate does not produce a valid invitation-to-reply conversion. That calculation would require a reply rate per accepted person from the same cohort.
For your own reporting, show how many unique contacts replied separately from how many messages were sent. Additional follow-ups change the message denominator, even when the number of people in the campaign stays constant.
Linked Helper workflow: improve messages and follow-ups
When acceptance looks healthy but replies lag, choose either message relevance or follow-up coverage as your next test. Linked Helper's personalization tools support custom variables and conditional templates, or profile-based AI messages. Disable auto-approval while reviewing drafts so that the reason for contacting each prospect is accurate and specific.
Build spaced follow-ups with a distinct purpose for each message. Configure Check for replies steps before follow-ups and remove detected respondents from the remaining sequence. Test that handling before scaling, then continue their conversation in the Inbox.
Measure unique replies / accepted connections for the cohort, qualified replies / invitations sent, and additional replies by follow-up step. Also check whether generic follow-ups were sent after a detected reply. The Messaged/Replied campaign view uses a different denominator; reconcile it with the cohort as explained below.
How many connections turn into meetings?
Reachium recorded meetings with 1.99% of accepted contacts, equivalent to 0.54% of invitations sent.
SmartReach's January–June 2026 report covers 1,800+ campaigns and 500K+ requests. Its illustrative funnel converts to approximately 26% acceptance, 4.7% replies per invitation and 0.3–0.4% meetings per invitation. SmartReach describes campaign-level aggregation, while Reachium pools contacts; keep the two estimates separate when setting expectations.
Both publishers describe tracked meetings as an undercount because some bookings happen outside their systems. A booked meeting also differs from an attended meeting or a sale.
Our recommendation: use your own meetings-per-invitation rate to plan workload, and track attendance and qualification in your CRM. A higher booking rate helps only if the meetings are relevant and happen.
Linked Helper workflow: move interested replies toward a meeting
If interested conversations do not become bookings, review the response and handoff. Use the AI Reply Assistant to draft an answer from the conversation history, then review it and propose one clear next action. Address the prospect's question before asking for a meeting.
For teams using Cloud-based storage, the Unified Inbox brings accessible accounts' conversations together. Tag interested contacts, add notes, assign a responsible person in your CRM, and send mapped lead data through a supported CRM integration or webhook. Check the plan requirements if the handoff needs message history.
Measure reply-to-human-response time, meetings / positive replies, and meetings / invitations sent in your CRM. Record attendance and qualification separately. This shows whether the next-step conversation and handoff produce useful meetings, rather than merely adding more replies.
LinkedIn outreach benchmarks by industry
Sender industry: a comparison with businesses running outreach
The following comes from Expandi's May 2025–April 2026 report:
| Industry | Sending accounts | Invitations | Acceptance | Replies per message |
|---|---|---|---|---|
| Staffing & recruiting | 462 | 423,792 | 36.5% | 18.9% |
| Human resources | 213 | 260,081 | 30.5% | 9.7% |
| Marketing & Advertising | 1,115 | 1,038,187 | 29.4% | 10.6% |
| Information technology & services | 1,825 | 1,731,259 | 28.4% | 10.5% |
| Management consulting | 976 | 1,029,342 | 28.0% | 9.2% |
| Computer software | 1,851 | 1,831,933 | 27.5% | 8.8% |
| Financial services | 767 | 732,855 | 26.0% | 10.3% |
| Telecommunications | 61 | 66,663 | 21.8% | 11.2% |
| Platform total | 13,302 | 13,218,869 | 28.5% | 10.4% |
Source: Expandi's full industry appendix.
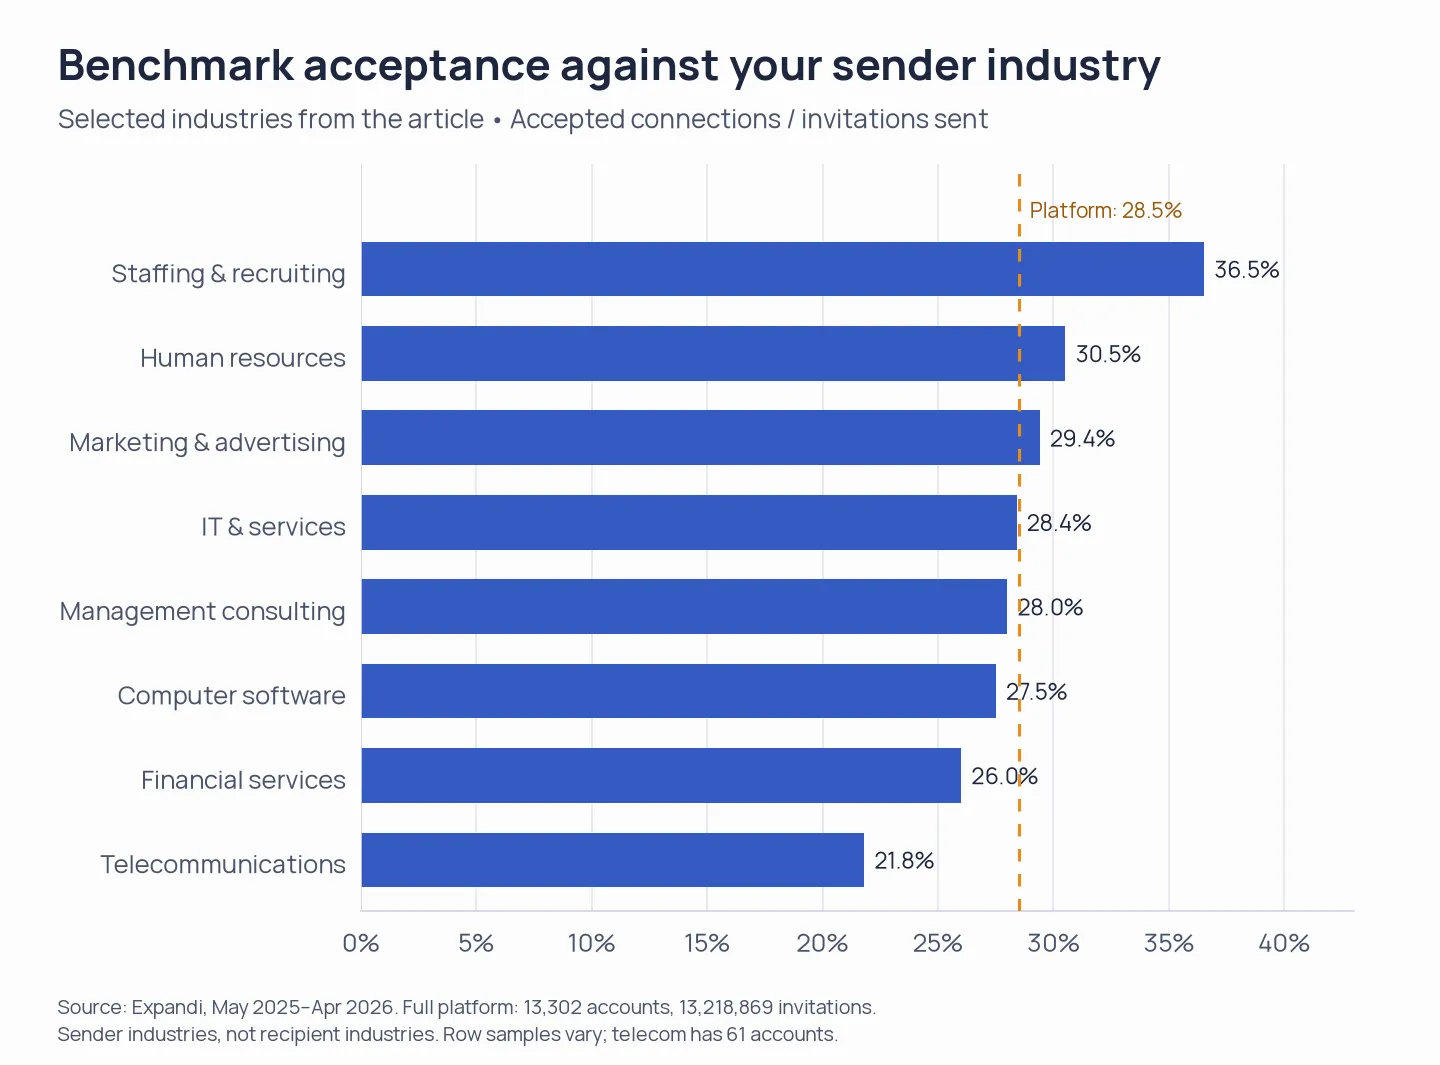
Expandi’s full-platform acceptance rate was 28.5%, while the selected sender-industry segments ranged from 21.8% to 36.5%. Use a relevant segment when diagnosing your campaign.
The displayed industries are a selection. The platform total covers the full dataset, including industries not shown here; these are recorded outreach events, not survey responses. The reply column uses outbound messages as its denominator.
An IT-services sender at 27% acceptance is 1.4 percentage points below Expandi's 28.4% industry figure; a staffing and recruiting sender at the same rate is 9.5 percentage points below its 36.5% figure. We would investigate the recruiter campaign first because the gap is larger. Start by checking audience fit and sender credibility, then test a change against the campaign's own previous results.
Check sending-account counts alongside invitation volume. A segment with many requests from a few senders is a weaker guide than a comparable segment spread across many senders.
Recipient industry: a different segmentation
If you sell to software companies, a software sender benchmark does not describe those recipients.
Reachium's recipient-industry study covers 30,364 requests matched to recipient industries. Acceptance was 30.9% for business services, 28.4% for technology and 20.5% for financial services.
That subset covers only 15.4% of its 196,696-request matured cohort, drawn from January 2025–July 2026 activity.
Its overall acceptance was 22.75%, versus 26.97% for the full cohort, and financial services contributed 53.6% of matched requests. These selection differences limit generalization.
For targeting decisions, use recipient-side data when it matches your audience. These figures can help prioritize a test, but the subset is too selective to treat its industry ranking as a rule for every campaign.
Connection requests with a note vs. without a note
Reachium compared 19,516 noted invitations with 160,639 blank invitations, all aged at least 30 days on Aug 6, 2026:
| Metric | With note | Without note |
|---|---|---|
| Acceptance | 22.60% | 27.66% |
| Replies per accepted connection | 47.80% | 25.54% |
| Replies per invitation | 10.80% | 7.06% |
| Tracked meetings per accepted connection | 1.29% | 2.06% |
Source: Reachium's note comparison. Requests were not randomly assigned to receive notes.
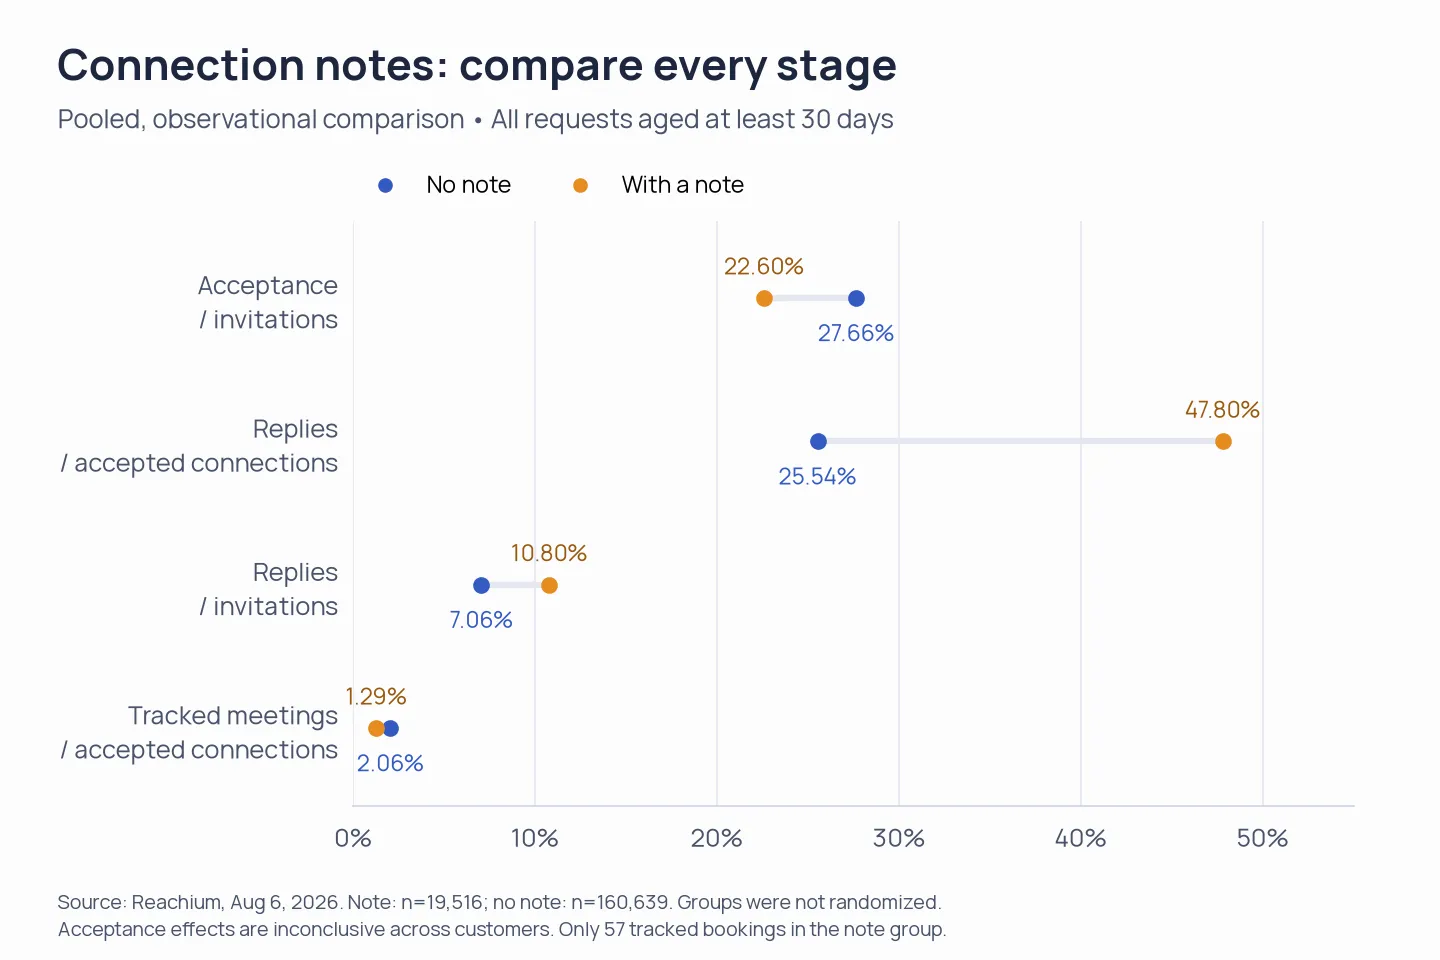
Requests with a note were associated with more replies, but the pooled comparison cannot establish a causal improvement. Evaluate acceptance, replies and tracked meetings together.
The pooled acceptance comparison is sensitive to who sends each kind of invitation. Within the three customer accounts that had at least 200 requests in each group, the acceptance differences associated with notes were +8.74, −9.89 and +0.81 percentage points. The direction varied across customers.
Notes were associated with higher replies per accepted connection in all three comparisons. However, each customer's targeting and follow-up sequence could also differ between groups. So the study cannot isolate the note's contribution. The noted group also recorded fewer meetings per accepted connection, based on just 57 tracked bookings.
For your own test, assign eligible prospects to note and no-note groups before sending. Keep the sender, audience criteria and subsequent sequence comparable, and choose the main outcome in advance. For a prospecting campaign, that might be qualified replies per invitation, with meetings tracked separately.
Use the originally assigned groups when comparing results. Looking only at people who accepted would hide any difference in acceptance and change the population being evaluated. Decide the observation window and sample plan before drawing conclusions; a fixed rule such as “50 accepted contacts per variant” cannot guarantee an informative result for every starting rate or effect size.
How to measure your outreach in Linked Helper
Open Linked Helper's Dashboard, select the campaign and reporting period, and download its statistics. Use Invited and Accepted to review connections, then Messaged and Replied to review conversations. For action-level detail, open the campaign's Statistics tab.
Refresh acceptance and reply statuses before exporting a report. Accepted updates when the relevant connection-checking action runs; Replied updates through messaging and reply checks. The Dashboard excludes invitation notes from Messaged but includes replies to invitations in Replied, and it counts Linked Helper activity rather than manual interactions.
Use the Dashboard for day-to-day monitoring. For a comparison with the accepted-contact benchmarks above, export campaign records and count unique people from the same invitation group, keeping replies from unaccepted invitees separate.
Use this workflow to build a campaign comparison:
-
Record the cohort Define which contacts received an invitation, the sending period and the measurement date. Keep separate campaigns or channels distinguishable.
-
Check the data's freshness Establish when acceptance and reply statuses were last checked. Distinguish the date an outcome was detected from the date it actually happened where that matters to your observation window.
-
Reconcile the contacts Use the available campaign records and exports to identify unique invited, accepted, and replying contacts. Keep replies from unaccepted invitees separate. If you cannot reconstruct those groups, retain the dashboard metric's own definition instead of relabelling it.
-
Calculate the four rates above Use one row per cohort in a spreadsheet. Record the raw counts beside the percentages so another person can reproduce them.
-
Add commercial outcomes Classify interested replies consistently and reconcile bookings against your CRM or calendar. Document any manual or external activity included in that calculation.
A useful comparison sheet includes campaign name, sender, audience, invitation dates, observation rule, measurement date, invitations sent, accepted contacts, accepted contacts who replied, accepted contacts with a booked meeting, and the four calculated rates. The formula labels above use S for sent invitations, A for accepted contacts, R for accepted contacts who replied, and B for accepted contacts with a booked meeting.
For interface instructions, see the Dashboard guide. For campaign planning, see our LinkedIn outreach guide.
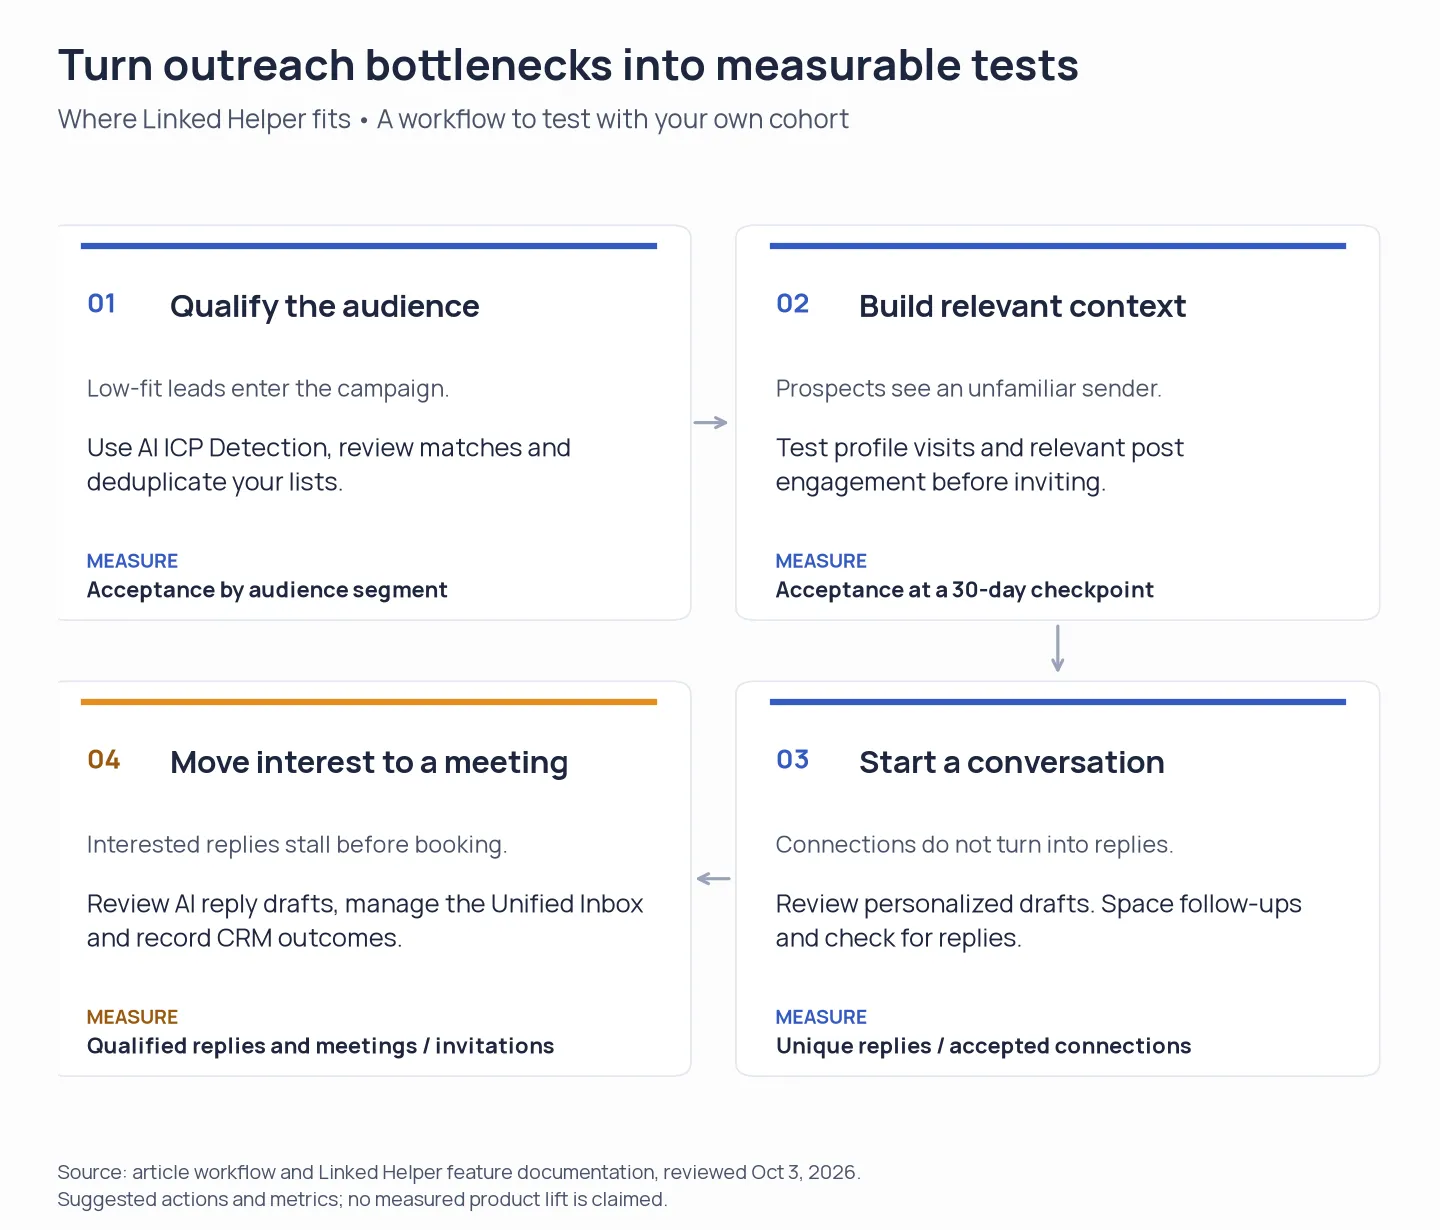
Linked Helper can support targeting, context, messaging and reply handling. Test each change against a matched control and track unique people through to qualified replies and meetings.
LinkedIn outreach trends to watch in 2027
These are planning priorities for 2027 based on research from 2025–2026, rather than measured 2027 conversion rates.
1. Track replies separately from acceptances
Reachium compares 101,191 invitations sent in 2025 with 78,964 sent in 2026. Acceptance rose from 26.33% to 28.11%, while replies per accepted connection fell from 32.19% to 21.98%. The practical lesson for 2027 is to watch both stages: steady acceptance can hide fewer conversations. This is a comparison within one vendor's cohorts, not a forecast of next year's LinkedIn-wide rates.
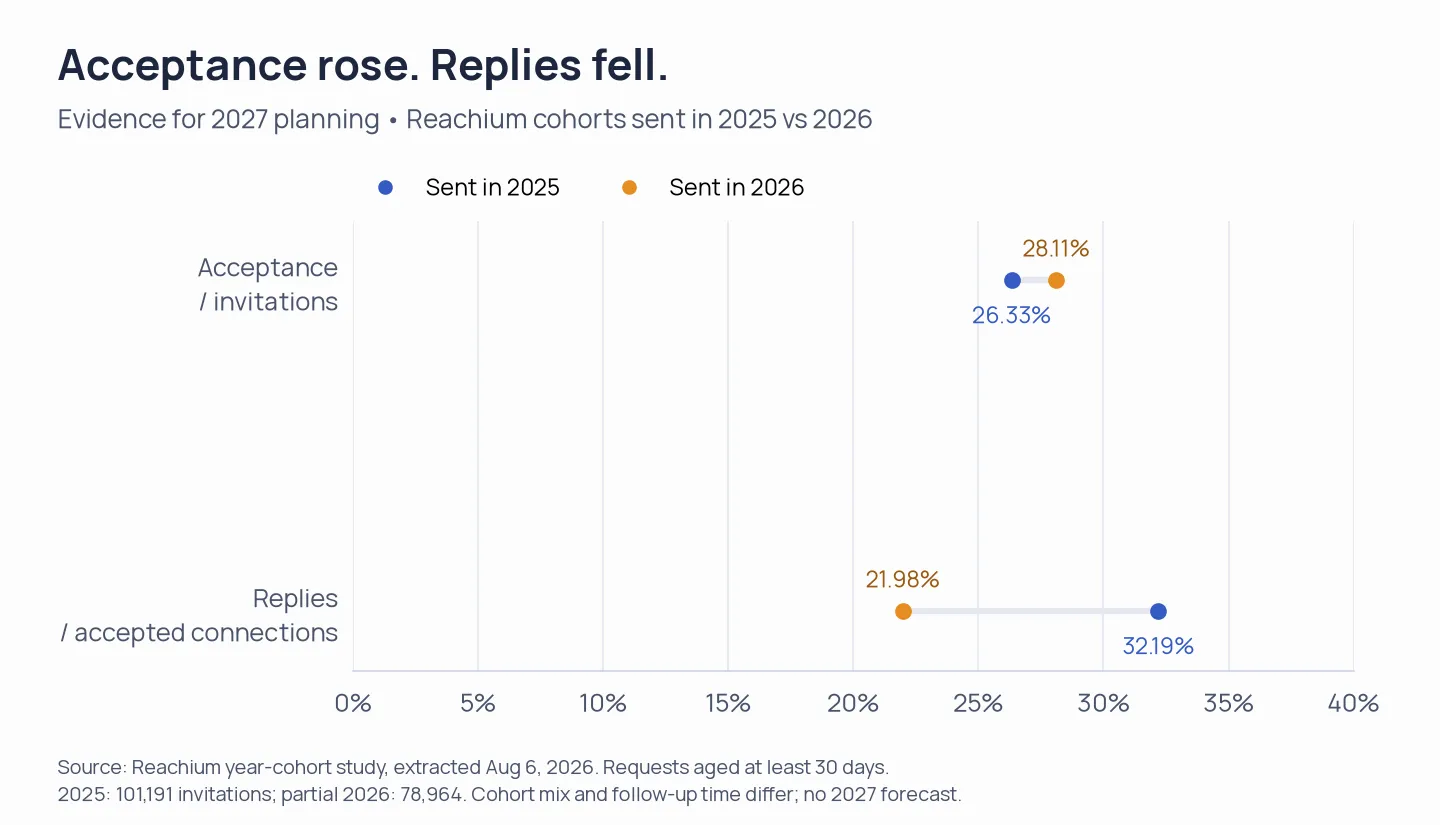
In these vendor cohorts, acceptance increased while replies per accepted connection decreased. For 2027 planning, monitor both stages and compare campaigns using consistent observation windows.
Expandi's note-reply measure fell from 3.5% in May 2025 to 2.2% in April 2026. Its denominator includes invitations without notes, so the decline could partly reflect fewer notes being sent rather than worse performance from each note.
If you use connection notes in 2027, report replies per noted invitation alongside the share of invitations carrying a note. That will help you distinguish a change in note usage from a change in response.
2. Keep invitation handling and campaign timing visible
LinkedIn's invitation guidance describes Focused and Other views and says recipients may not be notified about invitations in Other. It does not quantify the effect on acceptance. Record when campaigns ran and check the current invitation experience before treating an older benchmark as a direct comparison.
For 2027 planning, use a consistent observation window and compare recent campaigns with recent campaigns. Keep sending restrictions separate from conversion rates; our weekly invitation-limit guide covers the operational limits.
3. Test AI personalization against a human-written control
Expandi's H2 2026 report compared AI-personalized and human-written campaigns within the same accounts. Its AI analysis covered 118 campaigns from 73 accounts between October 2025 and June 2026. Human templates had about 12% higher acceptance, while reply rates were effectively unchanged. This was observational: audience differences and campaign maturity could still influence the result.
Our recommendation for 2027 is to use AI to draft messages, review them for relevance, then test them against a human-written version. Compare qualified replies per invitation and track meetings separately. Apply the same test to connection notes: the variant that gets more replies may not be the one that produces better sales conversations.
How we checked the benchmarks
Checks performed
We reviewed each publisher's population, measurement period, counted outcomes and denominators. We kept pooled rates separate from sender and campaign medians, and checked whether a report used independently collected data or another vendor's sample. We did not combine the studies into a LinkedIn-wide average.
We also checked data ownership. Belkins' 2026 study combines its own 14,077 contact records with an Expandi-supplied dataset; the Expandi portion is not an independent customer population. This prevents counting another publication as another source of independently collected evidence.
Limits to keep with every comparison
-
Customer selection Vendor customers choose their audiences, offers and workflows. Their results need not transfer to manual outreach or another platform's users.
-
Concentration Reachium's largest ten customer workspaces contributed 76.19% of requests in its core dataset. Read its pooled results as a benchmark weighted toward heavy senders.
-
Measurement differences Unique people, invitations and message events are different units. Even a shared denominator does not guarantee identical reply detection or attribution.
-
Time A minimum-age filter still gives older requests longer to produce outcomes. Fixed windows answer a different question.
-
Business outcomes A reply can be negative. Booking coverage may be incomplete, and meetings do not establish revenue.
-
Uncertainty A change of a few percentage points needs to be assessed in its own sample and design. A vendor's observed monthly variation is not a universal significance threshold.
Reachium's sending-day analysis found acceptance between 26.38% and 28.24% across a 196,696-request cohort. Our recommendation is to test timing after audience fit and message relevance, rather than expect a particular weekday to fix a weak campaign.