

 16 min read

TL;DR
- Power BI is my practical choice when your Microsoft plan already covers Pro.
- I gravitate to Tableau for linked views and polished presentations, but a private team can pay dearly for its seats.
- Google Data Studio gives Google-heavy teams an easy way to share reports at no license cost.
- Zoho Analytics wins me over with clear seat and row tiers; watch its 25-viewer minimum.
- Metabase makes database questions approachable, but hosting stays your team's responsibility.
- KNIME is my pick for repeatable data-prep jobs; its visible workflows aren't shared dashboards.
What is data analysis software?
Data analysis software converts raw inputs into insights: combining and cleaning the data, computing, investigating trends, and distributing the results. Certain offerings focus on dashboards. Others center on spreadsheets, statistical methods, or reproducible pipelines. Begin by considering where your information resides, which audience requires the output, and what degree of oversight the analysis demands.
At a glance
Free starts include Power BI Desktop, Tableau Public, Google Data Studio, Zoho's Free plan, Metabase Open Source, and KNIME Desktop.
| Tool | Free route |
|---|---|
| Microsoft Power BI | Free Desktop and a free Fabric account |
| Tableau | Tableau Public |
| Google Data Studio | Free self-service edition |
| Zoho Analytics | Free plan for 2 users and 10,000 rows |
| Metabase | Free self-hosted Open Source edition |
| KNIME Analytics Platform | Free desktop platform |
Quick picks
Power BI fits Microsoft teams, Data Studio fits Google reports, and Metabase fits existing SQL databases; the table shows each choice's limitation.
| Scenario | Tool | Why it fits | Limitation |
|---|---|---|---|
| Microsoft team building shared business reports | Power BI | Desktop authoring, Microsoft integrations, and familiar Pro licensing | Most report authors and viewers need Pro in shared capacity |
| Analyst presenting interactive visual stories | Tableau | Flexible, multi-view dashboards and detailed Creator/Explorer/Viewer roles | A five-person private team can cost far more than a single Creator license |
| Google Workspace user who needs shareable reports | Google Data Studio | Standard reports and viewers carry no license charge | Connector choice and advanced data preparation are separate questions |
| Small team wanting packaged analytics | Zoho Analytics | Its Standard plan starts with five users and one million rows | Additional viewers are sold in a 25-person minimum pack |
| Team whose data are already in a SQL database | Metabase | Visual questions and dashboards sit directly on database data | Open Source means self-hosting and database administration |
| Analyst automating recurring cleanup steps | KNIME Analytics Platform | Visual nodes make a repeatable transformation sequence inspectable | It does not replace a shared BI service by itself |
What makes the best data analysis software? Five things to compare
I rank tools by the work they make easier: a dashboard, custom analysis, a cleaned file, or a workflow you can rerun. Then I look at the data’s starting point, visible prep, sharing, and the full yearly cost.
1. Match the tool to the analysis
For routine business questions, I start with a dashboard tool. Notebooks and statistics packages give you more room for custom analysis, while workflow tools keep repeatable transformations visible. First decide whether you need an interactive dashboard, statistical analysis, a cleaned file, or a workflow you can rerun.
2. Trace your data source
A local spreadsheet may need only a desktop app. For weekly CRM and billing refreshes, connectors or a database matter more than another chart type. Start with refresh and joins; a polished dashboard can’t rescue stale or disconnected records. If LinkedIn leads are part of your source data, Linked Helper’s LinkedIn data export can send the records to CSV or Google Sheets for analysis.
3. Separate preparation from visualization
Treat preparation and visualization as separate jobs: Power BI pairs Power Query with a model layer; KNIME exposes transformations as nodes; Metabase queries usable database tables.
4. Price the people who use the result
In my view, advertised starting prices rarely describe a working setup. Include author, viewer, and guest seats, then add annual billing, seat minimums, hosting, and capacity. A free authoring plan may publish reports publicly or leave you without team controls, so the cheapest tier can mislead.
5. Account for control and maintenance
Cloud software saves infrastructure work, but your data and access still pass through the provider. Self-hosting gives your team more control and more chores. Before linking sensitive data, check sign-in controls, workspace permissions, refresh options, and who handles updates.
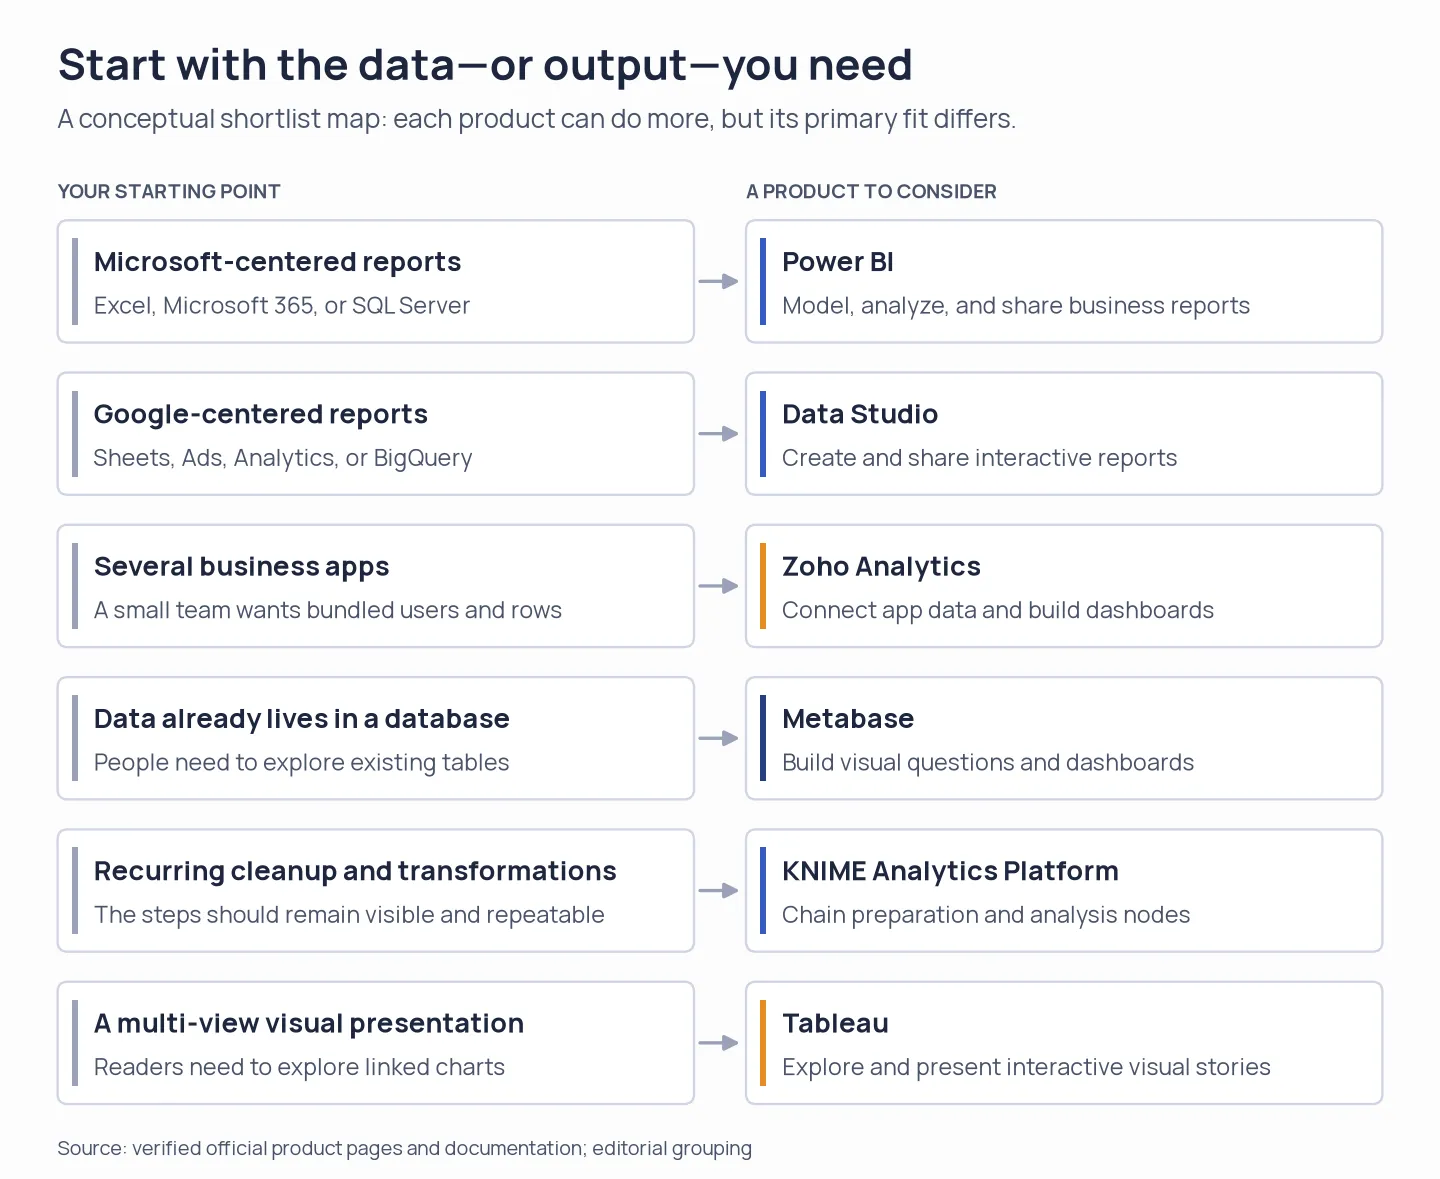
Start from your data source or desired output. Each tool fits a different part of an analytics workflow.
1. Microsoft Power BI: Best for Microsoft-centered reporting teams
Power BI makes the most sense when your team already works in Excel and Microsoft apps. I prefer it when an enterprise plan already covers Pro. Desktop is free, but private sharing through the service usually means every author and viewer needs Pro or Premium Per User on shared capacity. If you have Microsoft 365 E5 or Office 365 E5, Pro may already be covered. I wouldn't pay for cloud sharing before checking whether existing licenses cover the people who need access.
Pros — Microsoft Power BI
- Use Power Query to prep data, build a model, and create interactive reports in the browser or Windows app.
- Eligible Microsoft 365 E5 and Office 365 E5 users may already have Pro.
Cons — Microsoft Power BI
- Free accounts don't include private sharing; Pro costs $14/user/month, billed annually.
- Learning DAX, model design, and workspace controls takes work. Fabric adds another layer to navigate, which felt like a lot for my one-file summary.
Arvind D., a 3.5-star G2 reviewer, wrote on October 29, 2026, that “licensing costs, workspace permissions, and sharing reports with external users can sometimes be complicated.” The review echoes what I saw: sharing deserves a place in the budget. If E5 covers Pro, confirm which teammates can use it in the workspace before choosing another plan.
My free account let me start a report in the browser with Excel, CSV, manual entry, or published semantic models. I liked seeing those options before installing Desktop; the desktop app still offers more sources and fuller data work.
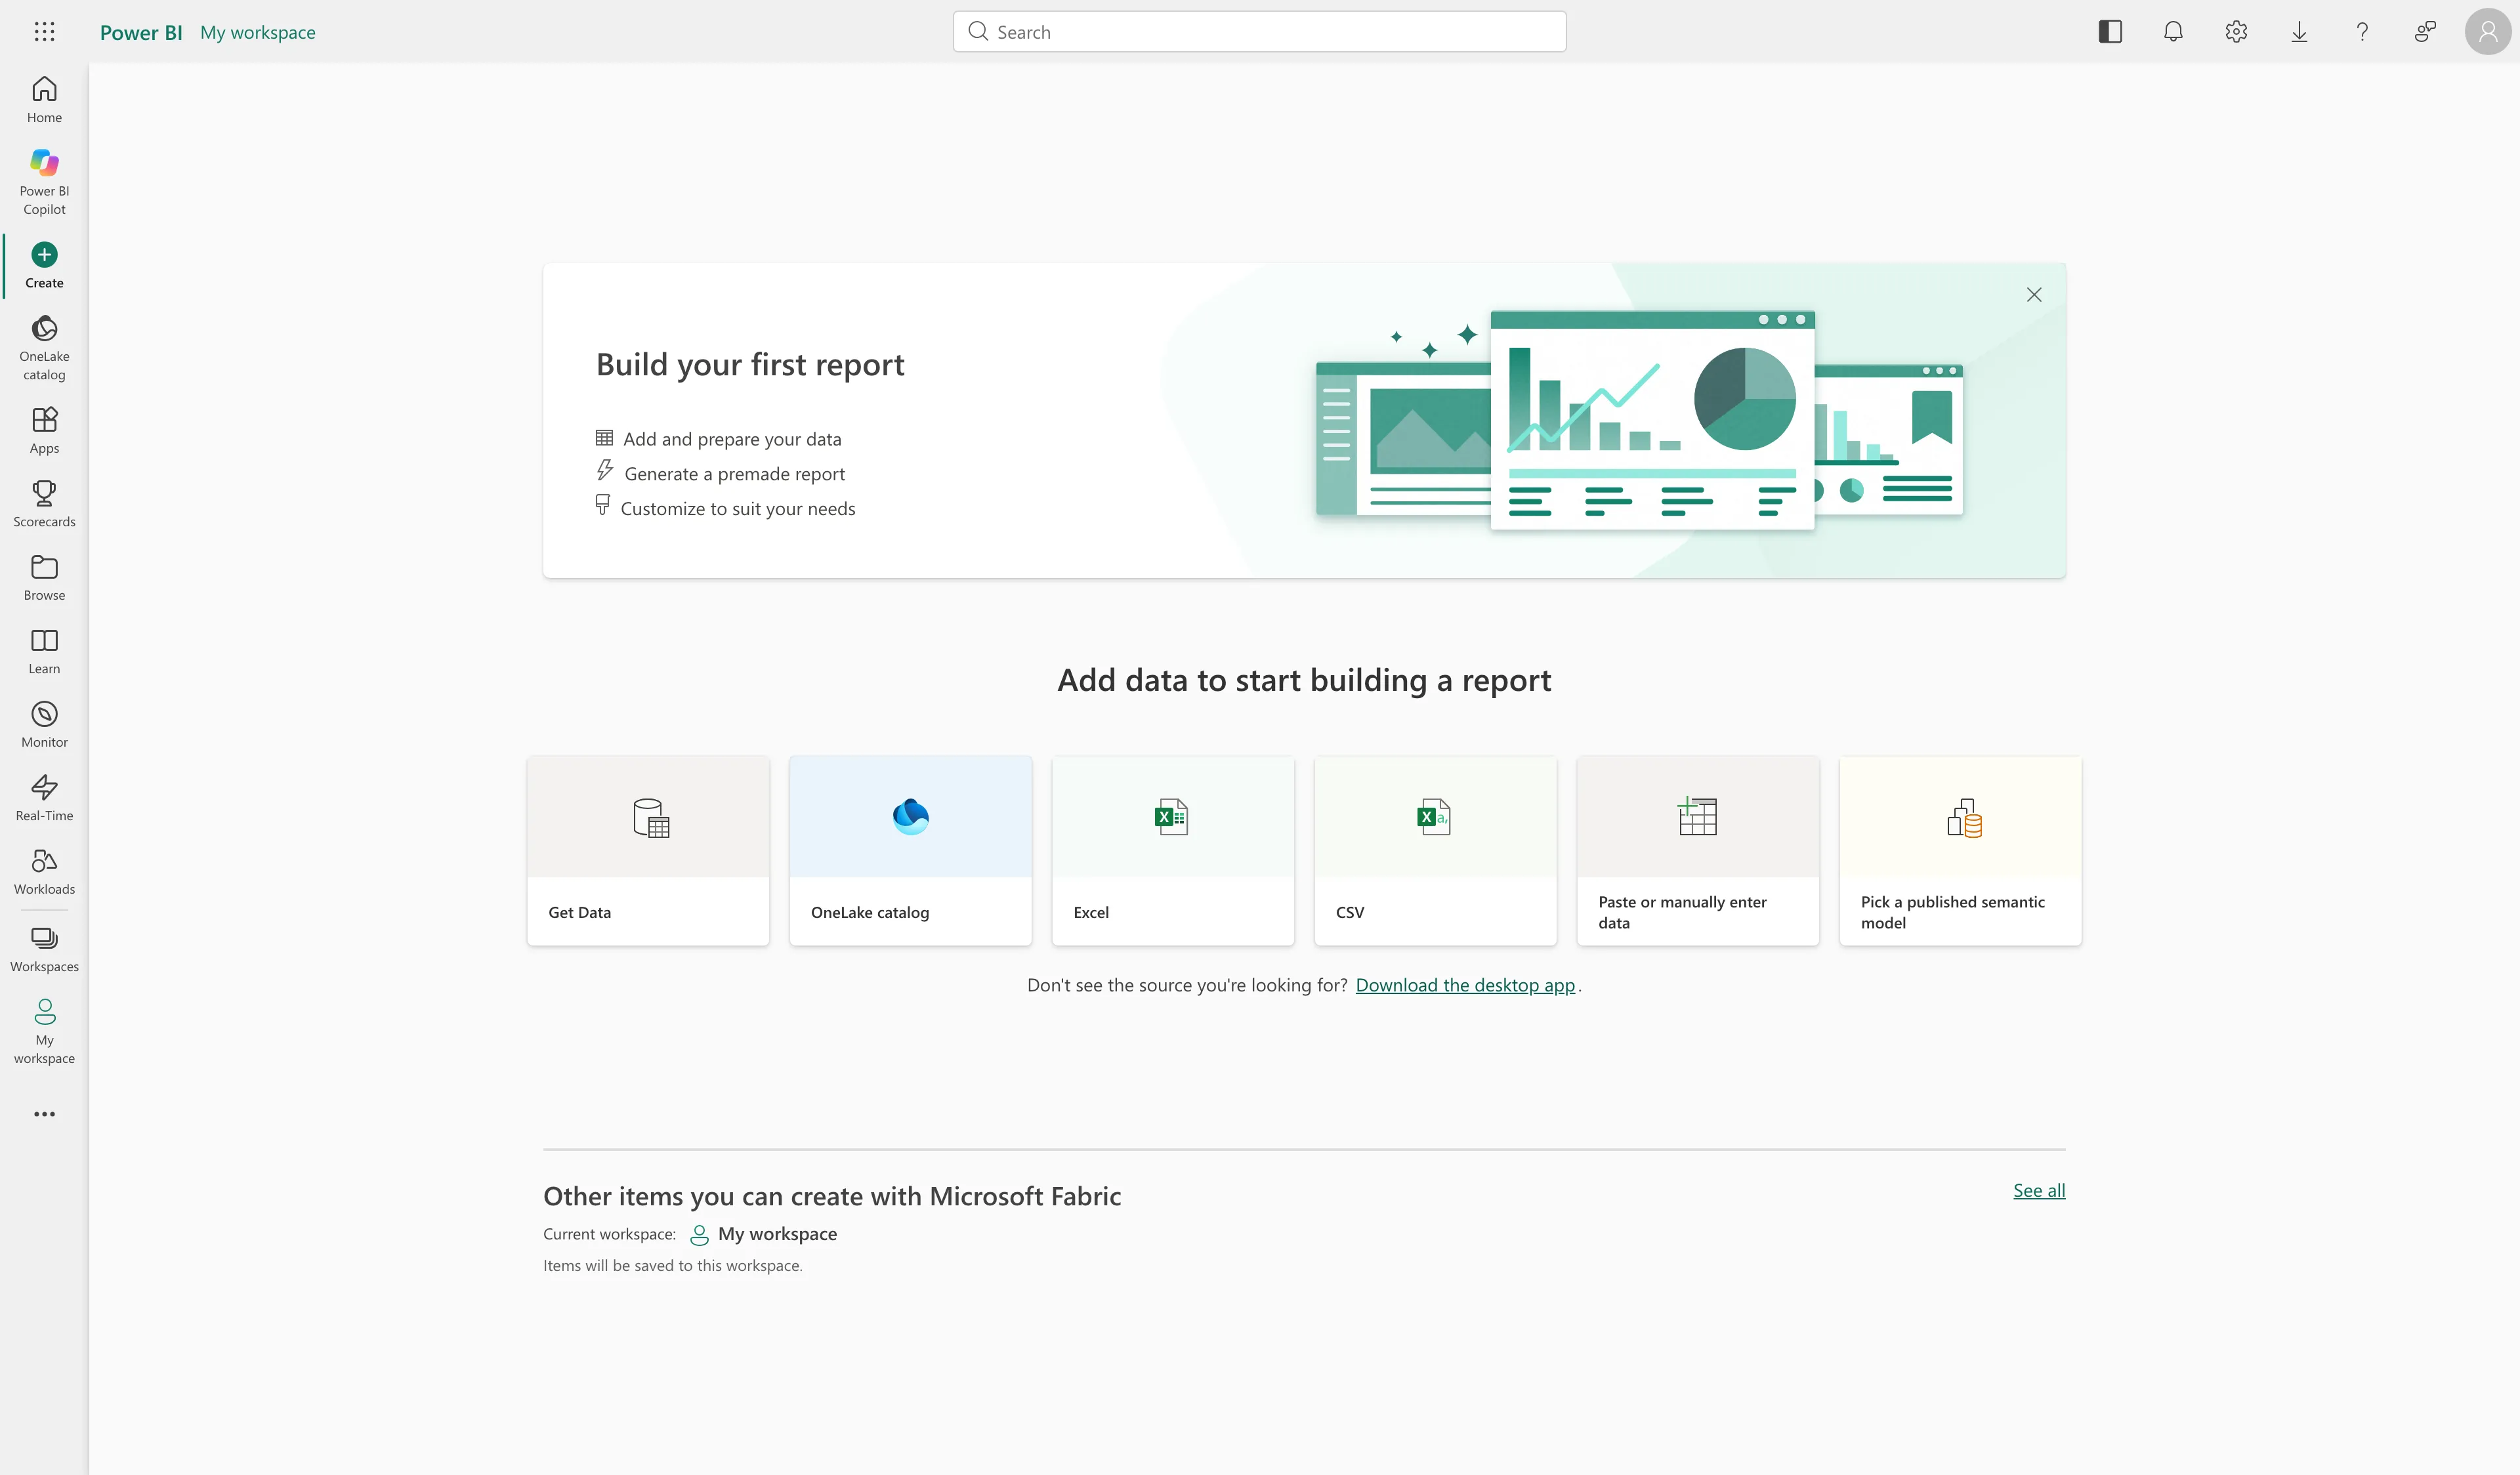
Power BI's browser starter offers several ways to begin a report, including manual entry.
Product pricing — Microsoft Power BI
Power BI Desktop and a Fabric free account are free. Pro is $14/user/month and Premium Per User is $24/user/month, both paid yearly. Five Pro users cost $840/year before tax. Existing E5 entitlements or qualifying Fabric capacity can lower the incremental cost for eligible teams.
2. Tableau: Best for visual exploration and polished presentations
For analysts who need to explore linked views and present a polished story, Tableau earns my recommendation. I like that Creator, Explorer, and Viewer roles separate authoring, editing, and reading; the downside is that a $15 Viewer seat isn't a complete team setup because every deployment still needs a Creator.
Pros — Tableau
- Give creators, explorers, and viewers different access through their named seat roles.
- Combine several views and controls in one workbook so readers can follow connected patterns.
Cons — Tableau
- Tableau Public makes every published workbook public, so keep confidential reports elsewhere.
- You need at least one Creator; annual Cloud seats cost $75, $42, or $15/user/month by role.
I switched from a storm-tracking sheet to an economic dashboard with range controls in Tableau Public. It also asked for organization details before I reached the authoring flow. In Tableau's pricing calculator, one Creator and four Viewers came to $1,620 a year before tax. Those range controls made the economic dashboard feel more interactive than a static slide. I prefer that Viewer mix when coworkers mostly read; teams editing published sources should budget for Explorers.
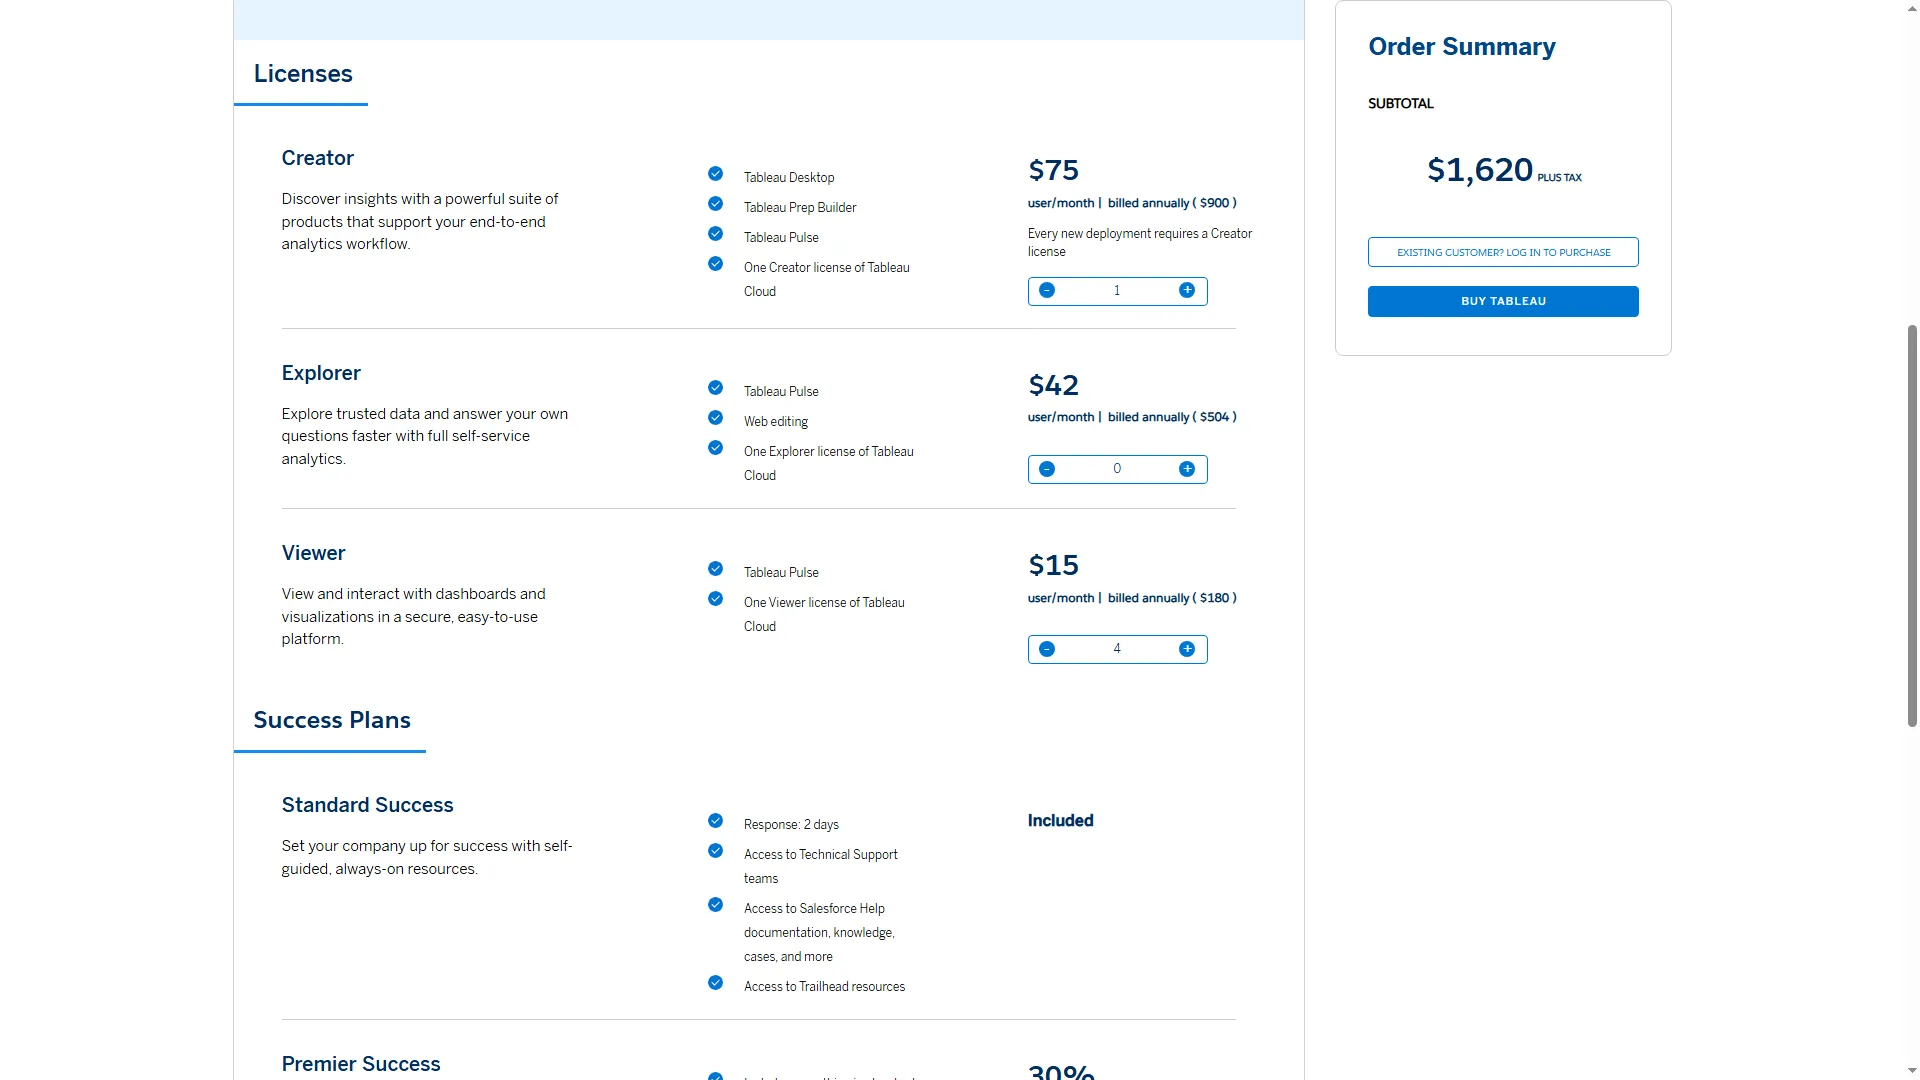
This role mix gives report readers Viewer access while keeping a Creator seat for publishing.
Product pricing — Tableau
Tableau Cloud Standard starts at $75/month for one Creator, billed annually. One Creator and four Viewers cost $1,620/year before tax. One Creator and four Explorers use a higher-cost role mix; capacity-based Viewer blocks are also available by quote. Tableau Public is free, but its published workbooks are public.
3. Google Data Studio: Best for free, Google-centered reporting
Google Data Studio (previously Looker Studio) is a simple no-license fit for Google-heavy teams that want shareable reports. It builds interactive reports around Google Sheets data, such as LinkedIn leads exported to Google Sheets, as well as Ads, Analytics, or BigQuery data. Creators and viewers pay nothing on the standard edition. Pro adds administration and team-management controls when a team needs them. I liked changing the Country filter in a public report more than reading another feature list: it showed me what viewers could explore before I connected data. Standard is my default unless admins need Pro's extra controls.
The connector choice is the catch: confirm sync and access before promising a new report to the team.
Pros — Google Data Studio
- Connect reports to 1,400+ sources, including Community Connectors and Google's own products.
- Let report creators and viewers use the Standard edition without a license fee.
Cons — Google Data Studio
- Build reports and visualizations, but use another tool for full data pipelines or statistics.
- Pro charges $9/user/project/month, so each added project increases the bill.
I opened a gallery report and changed the Country filter, which exposed country, device, and date controls before I created a data source. That made it useful for seeing what report viewers can change before I connected data. To author, you'll need a Google account, and the owner's private-sharing settings didn't show in the public report.
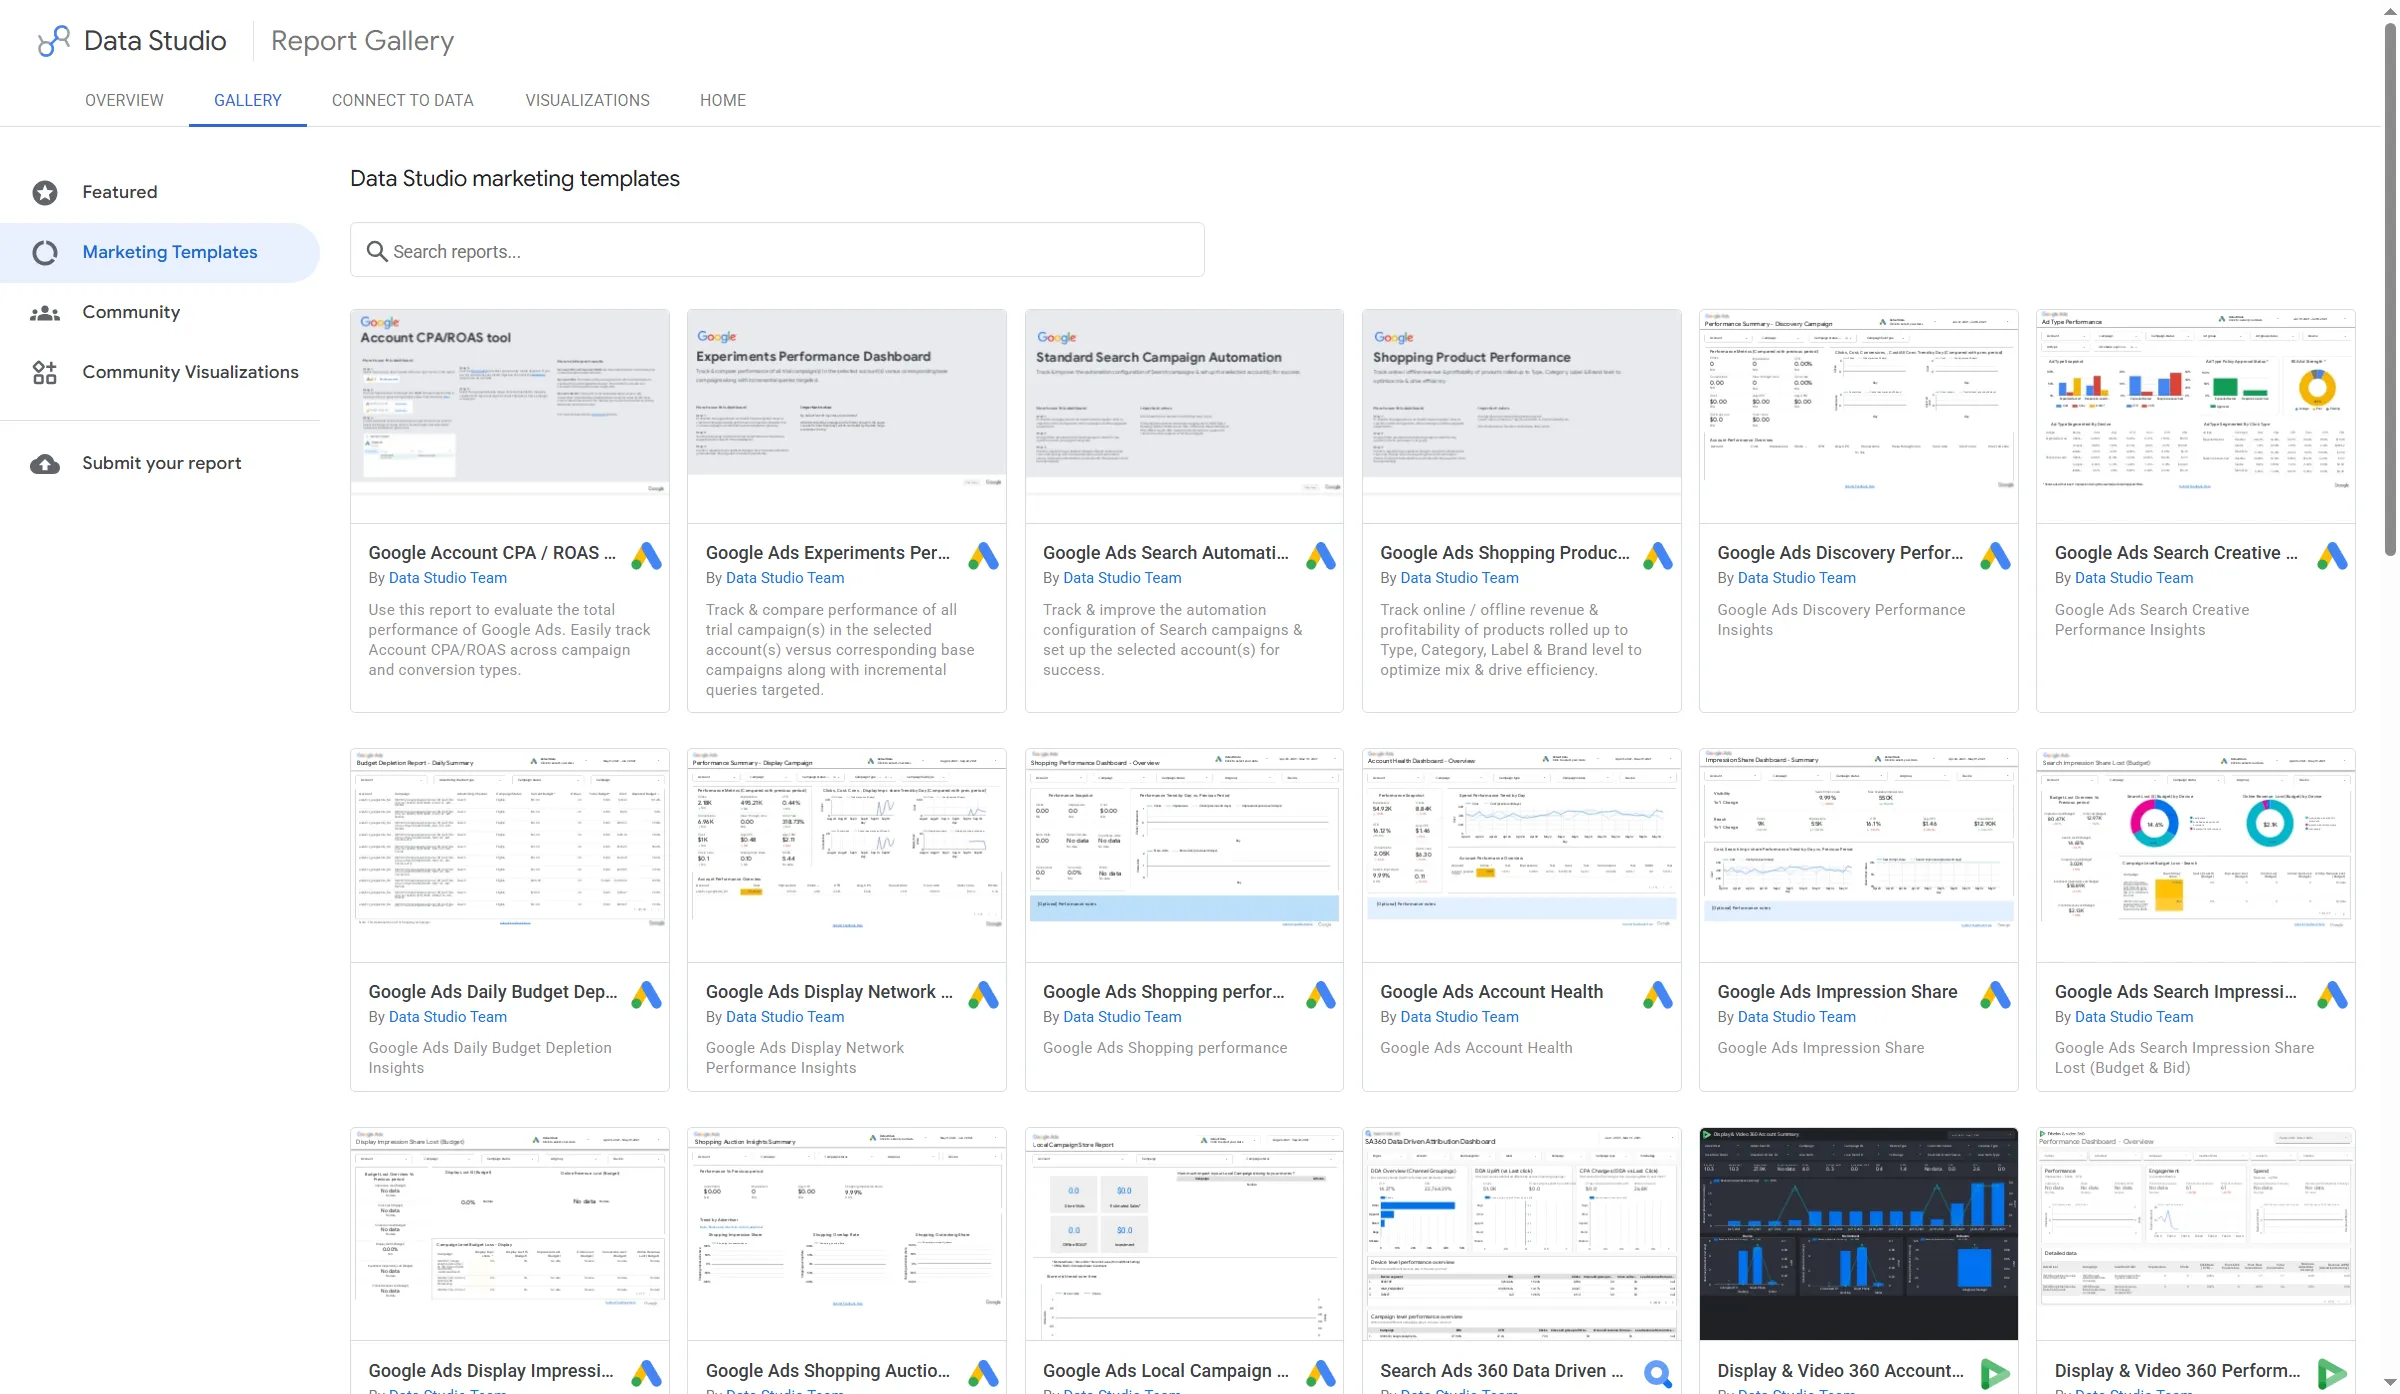
Google's template gallery includes reporting examples for campaigns, shopping, and creative performance.
Product pricing — Google Data Studio
Data Studio self-service is free for creators and viewers. Data Studio Pro is $9/user/project/month. Five users on one project would total $540/year before tax if the team needs Pro administration and support.
4. Zoho Analytics: Best for small teams that want bundled seats and rows
Zoho Analytics bundles dashboards and business-app connectors for small teams. Standard's seat-and-row limit is refreshingly clear: five users and one million rows. The Viewer add-on has a 25-person minimum, which can make the total bill much larger for a small audience. I wouldn't choose it for a team where only a handful of people need viewer seats.
I found the free tier generous on workspaces but strict on rows; 10,000 is a small ceiling once a report grows beyond a sample.
Pros — Zoho Analytics
- Get unlimited reports and dashboards, 5 workspaces, 10,000 rows, and 2 users on Free.
- Standard gives you 5 users, 1 million rows, 80+ visualizations, and read-only viewer roles.
Cons — Zoho Analytics
- Buy viewers in blocks of 25, even if your audience needs fewer read-only seats.
- Check complicated calculated tables before you commit. My trial showed connectors for local files, cloud drives, databases, CRM, ads, and finance. The breadth looked impressive, but the list leaves sync frequency and access unclear; check those details before choosing a connector.
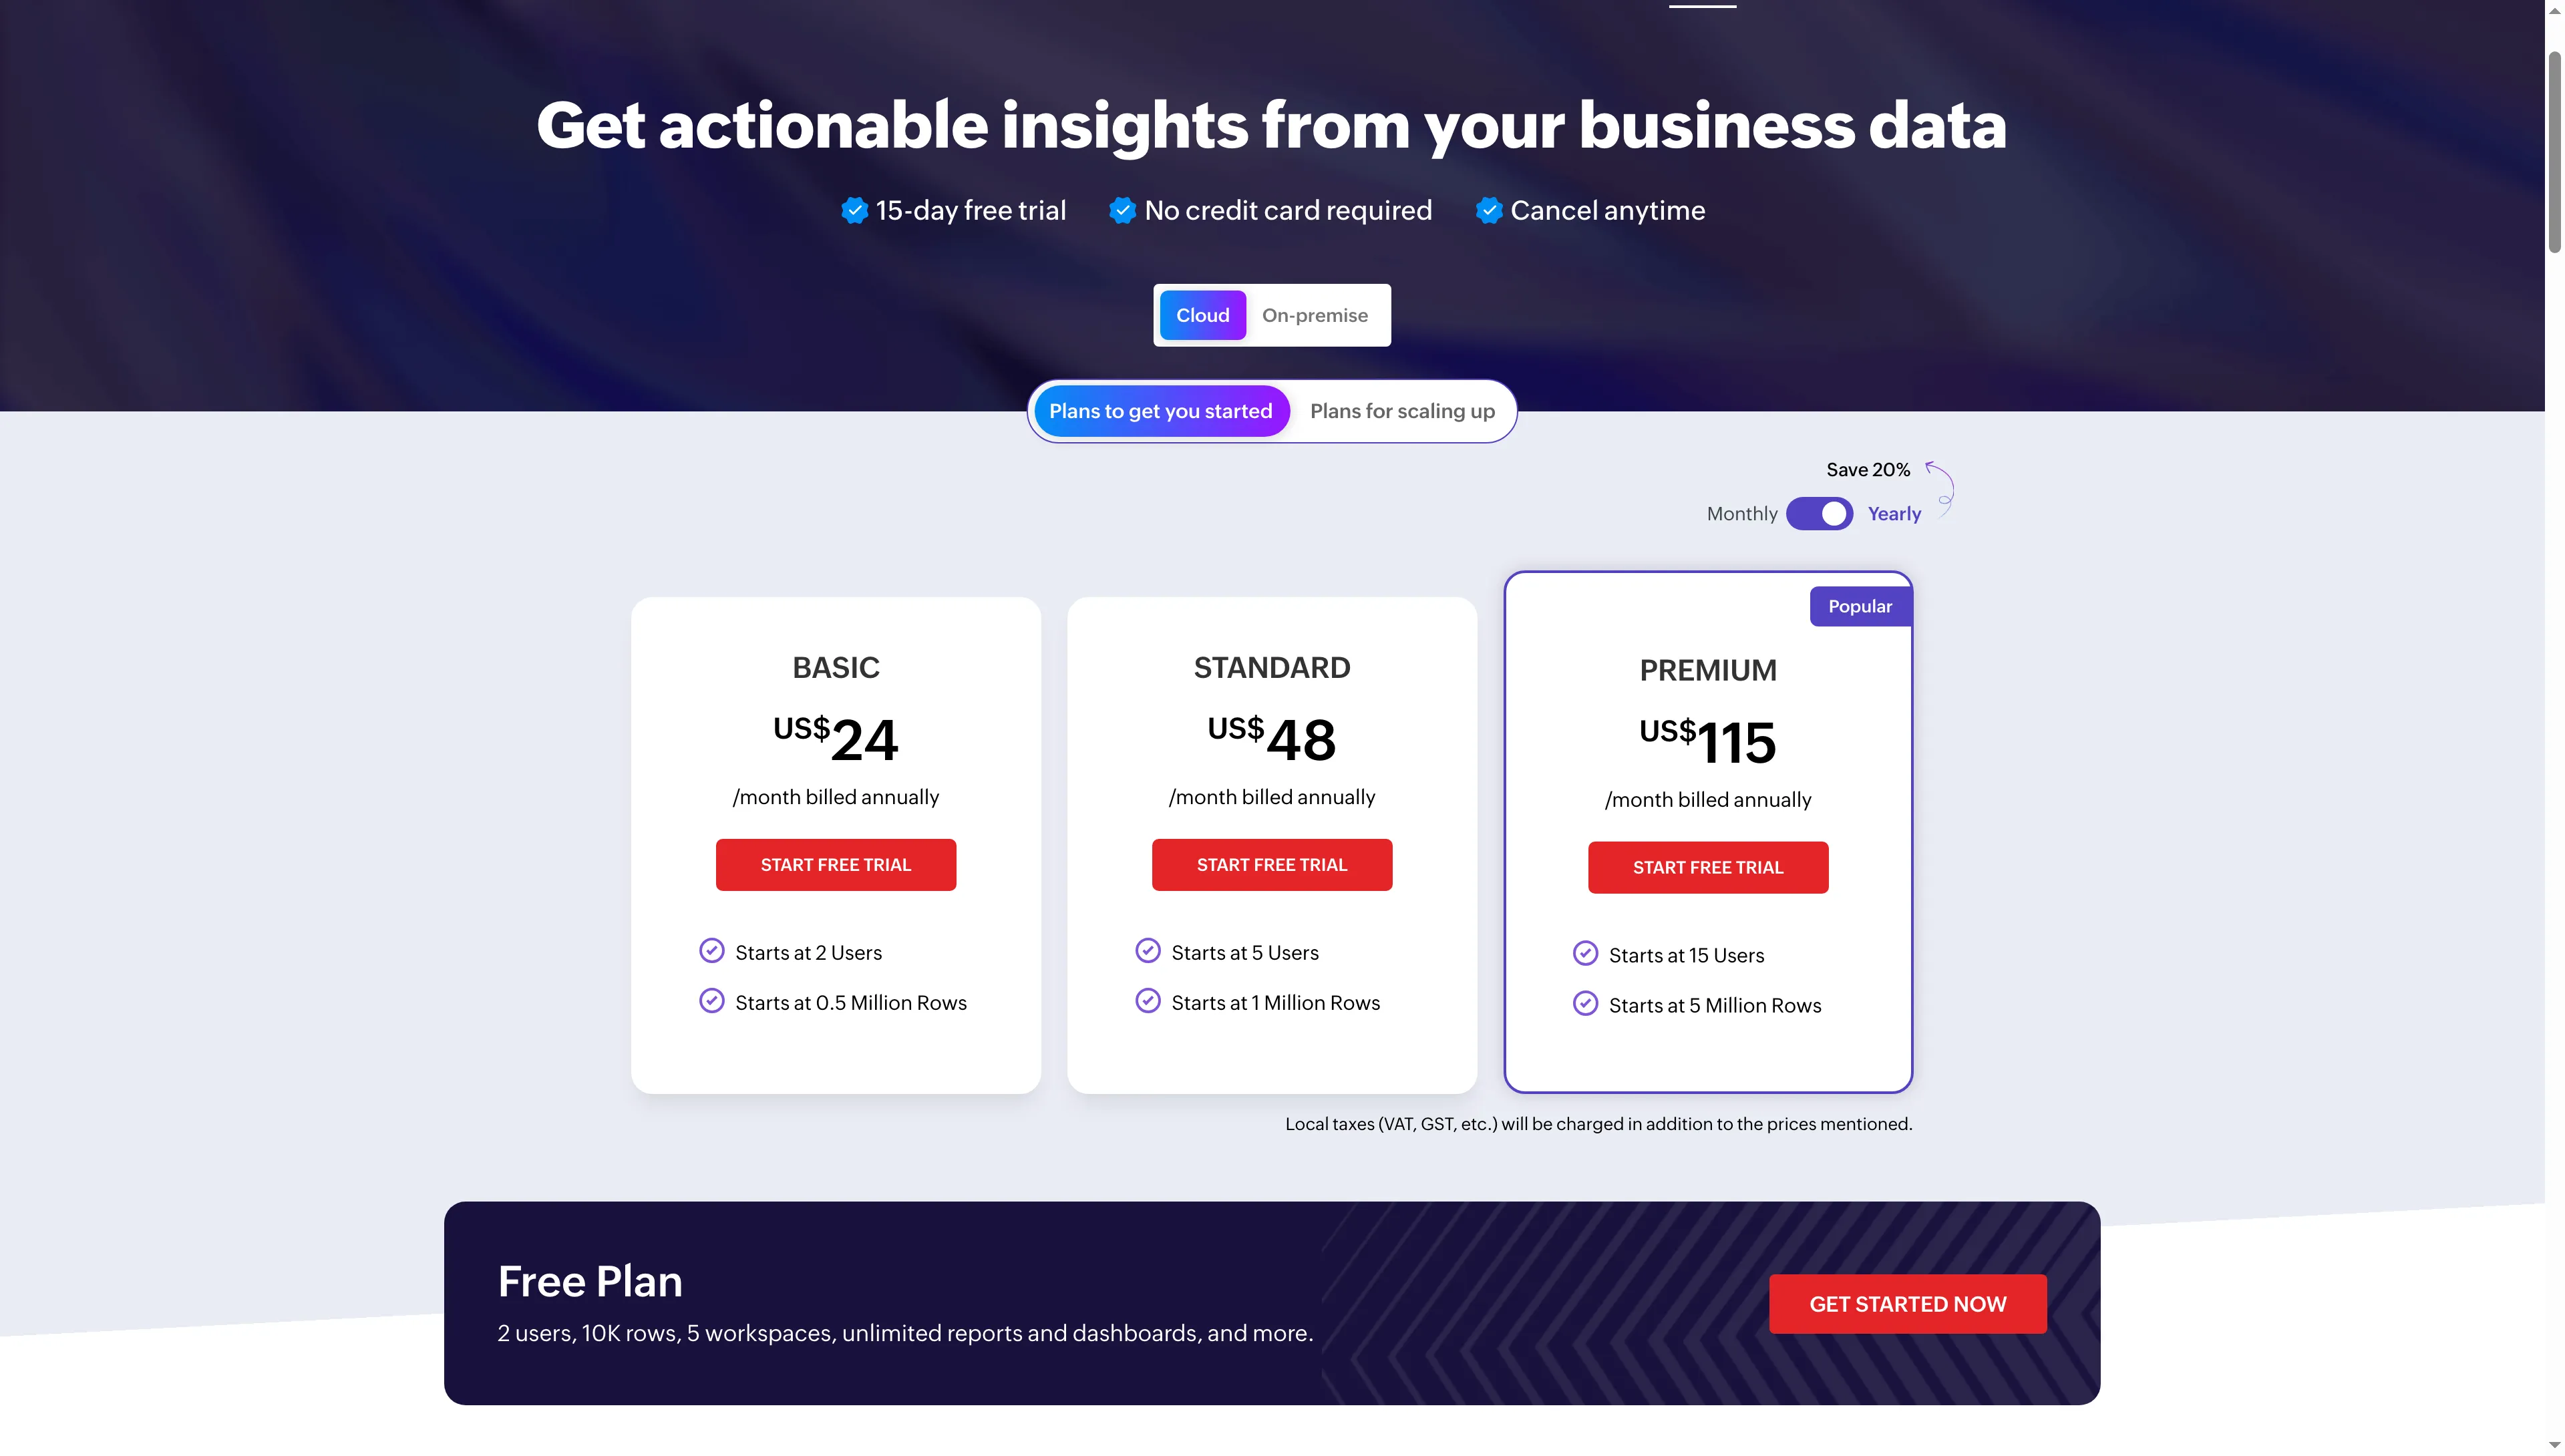
Zoho Analytics bundles users and row limits, so compare the whole plan rather than its headline monthly price.
Product pricing — Zoho Analytics
Free for 2 users and 10,000 rows. Basic is $24/month billed annually for 2 users and 500,000 rows, and Standard is $48/month billed annually for 5 users and 1 million rows. A 25-viewer add-on is $80/month billed annually. Taxes and extra row packs can change the final bill. If you're buying for a small audience, budget for the viewer minimum.
5. Metabase: Best for database-first self-service analytics
Metabase works best when your data already live in a database. I read its visual-query guide's sample: start with Orders, filter Created at and Total, sum Taxes, then group by Product Category and month. I like this on-ramp for coworkers who want to explore prepared tables visually, then switch to SQL when a question needs more control.
Pros — Metabase
- Give signed-in users unlimited access on Open Source, with 20+ data sources.
- Let spreadsheet-minded coworkers ask database questions visually, then switch to SQL for more control.
Cons — Metabase
- Host Open Source yourself and handle the server, backups, and updates.
- Starter costs $90/month, billed annually, for 5 users; every signed-in person counts, while unsigned guest views are excluded.
Metabase's subscription example starts with billing data synced and modeled in a database, so it won't help much if you're cleaning up a stray spreadsheet. Its conversion view needs plan and event fields in place. I start with that prerequisite before choosing a dashboard template. I wouldn't pick it for ad hoc analysis on scattered files.
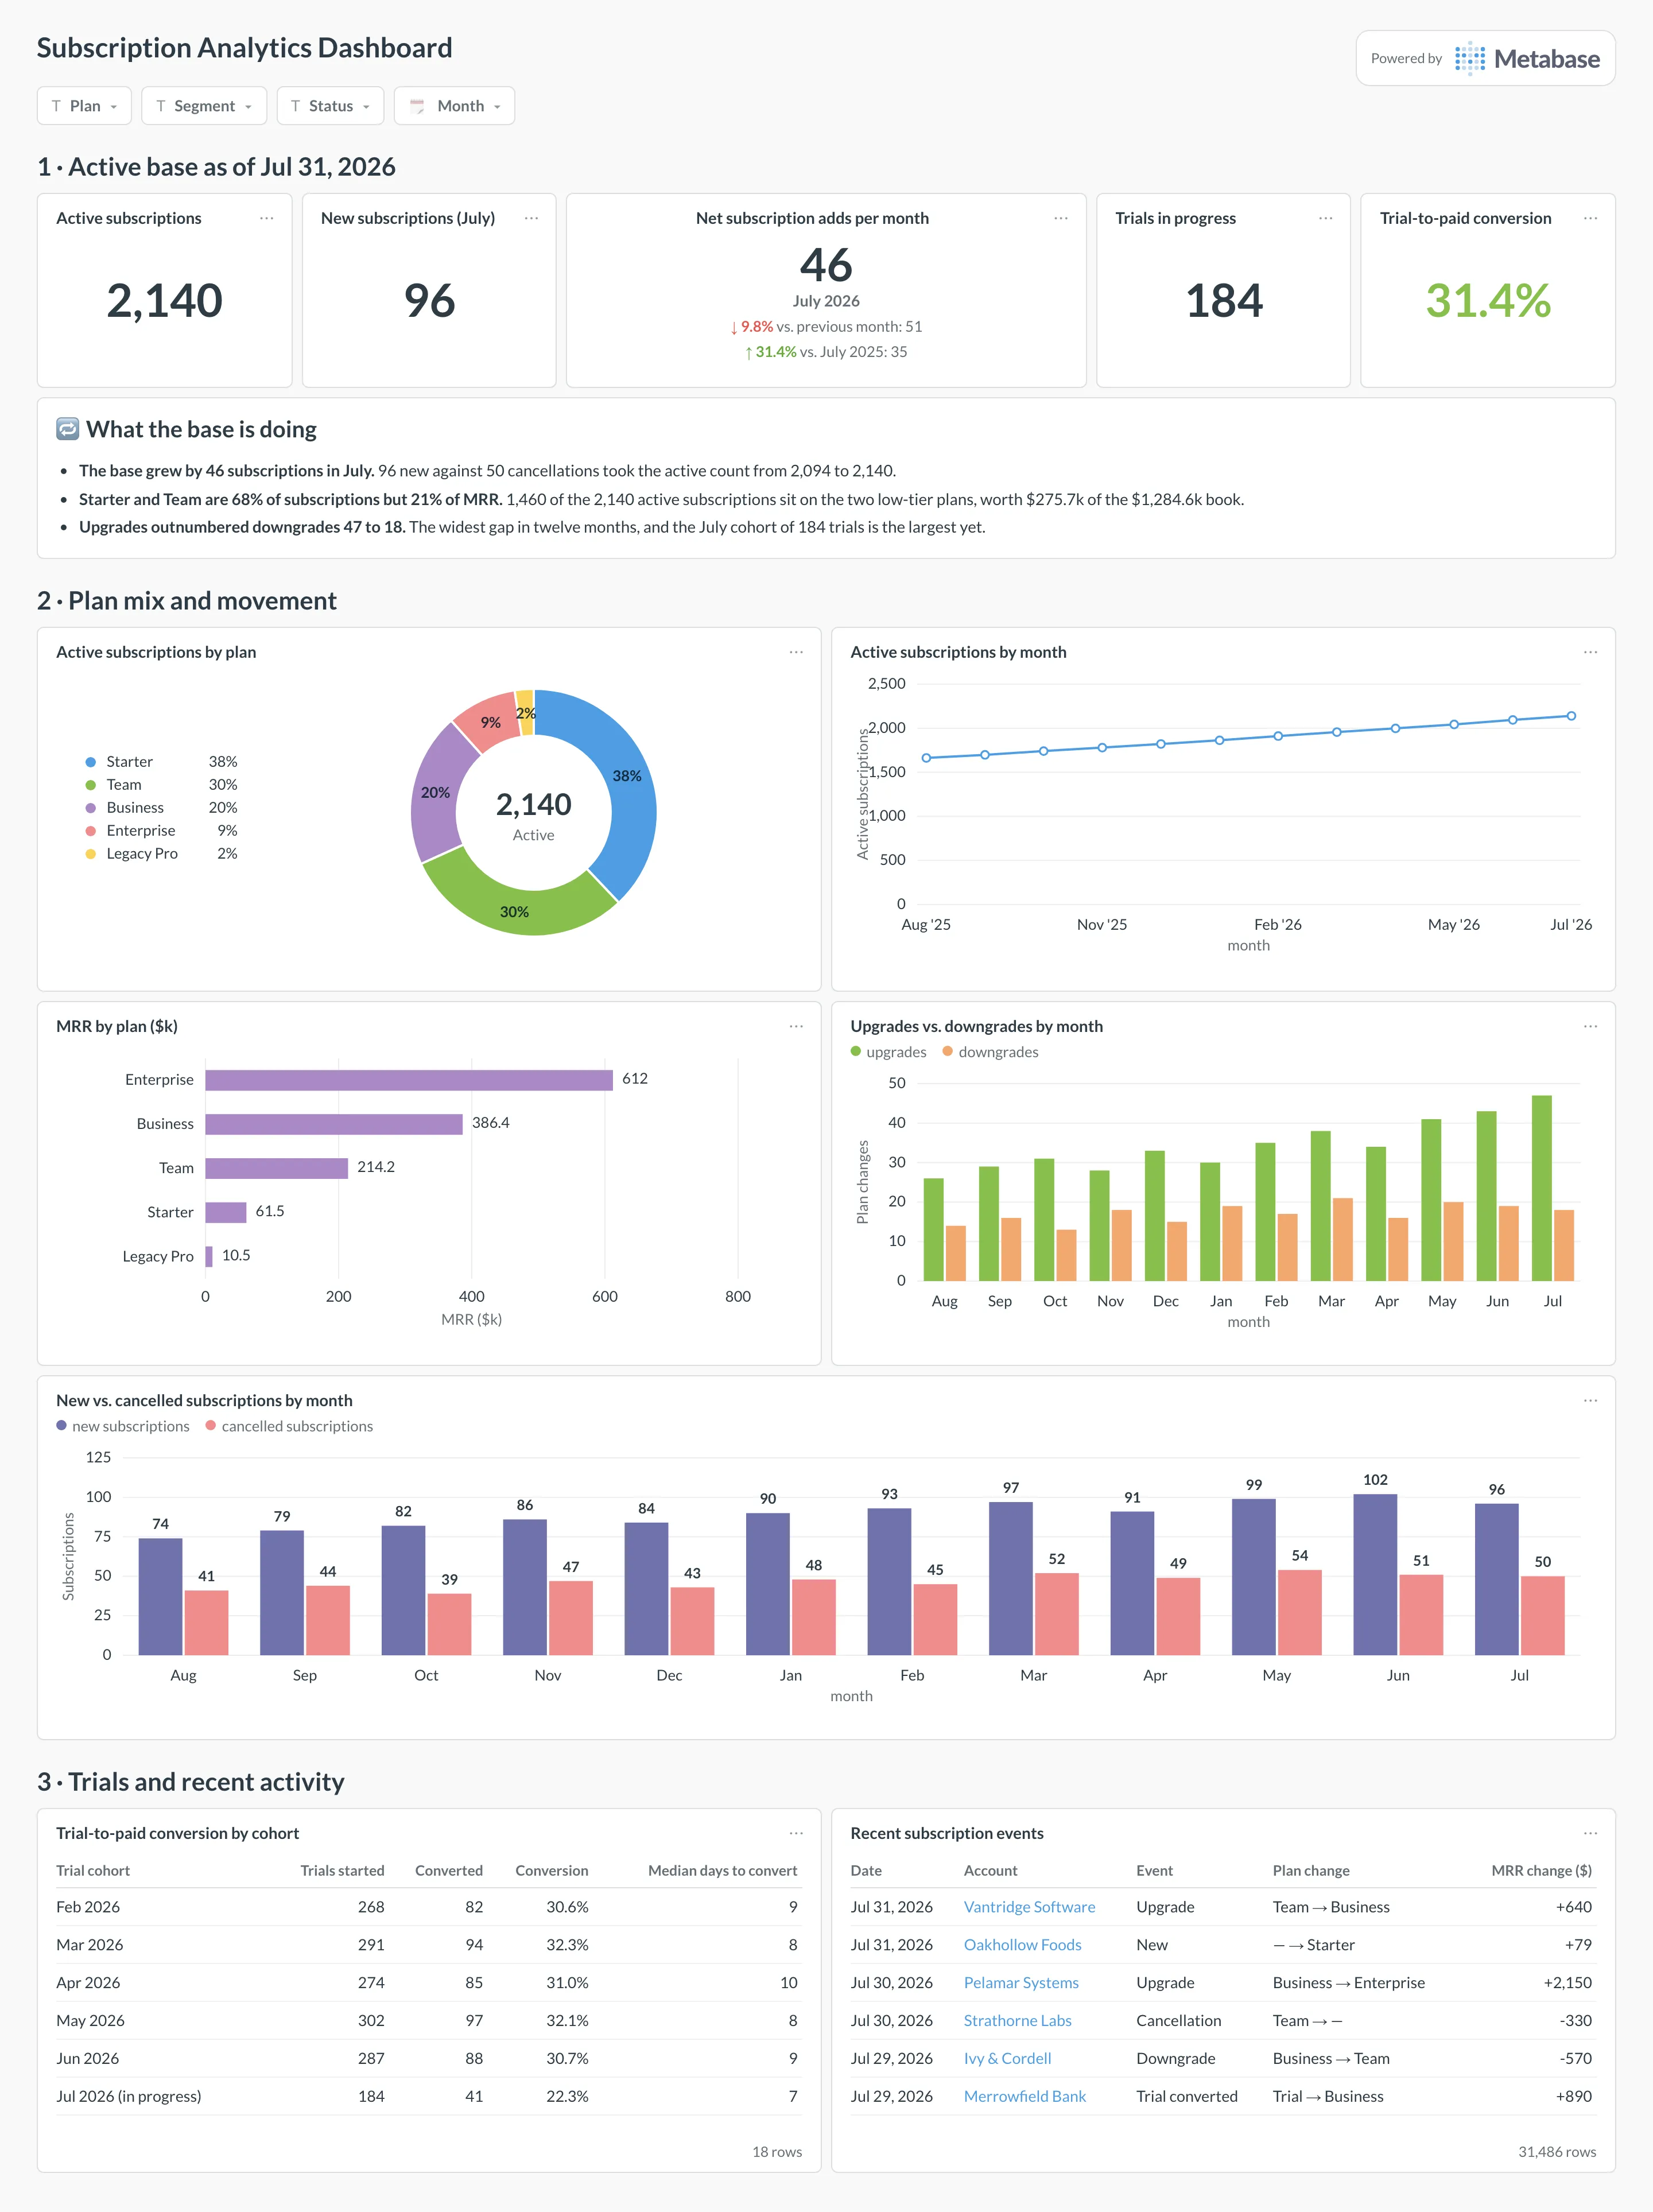
The dashboard brings subscription KPIs, plan mix, and recent account changes into one view.
Product pricing — Metabase
Open Source is free to self-host. Starter costs $90/month billed annually for the first five users. Hosting and database costs are extra on the self-hosted plan. Pro starts at $517.50/month billed annually and adds row-level permissions and SSO.
6. KNIME Analytics Platform: Best for repeatable visual data preparation
KNIME Analytics Platform is for analysts who repeat cleanup work and want visible steps. I read its six-step spreadsheet guide: two Excel inputs feed a column filter and merge before charting, lookup, and aggregation. I like that teammates can inspect or change a node without digging through a long script.
Pros — KNIME Analytics Platform
- Build automation, analysis, and data-prep workflows for free on desktop.
- Follow a spreadsheet workflow through nodes for reading, filtering, combining, charting, lookup, and aggregation.
Cons — KNIME Analytics Platform
- A quick cleanup can take more nodes than a spreadsheet formula.
- You need another tool to publish shared dashboards; the free desktop app keeps workflows local.
KNIME's example shows where each transformation happens. I'd use it when a teammate needs to repeat and explain the cleanup; for a one-off Excel fix, the extra clicks aren't worth it.
The free desktop app is a clear start for one analyst, but team deployment is a separate purchase. KNIME Hub uses capacity-based pricing instead of a simple per-seat rate, so compare the quote with the workflows your team actually needs to share.
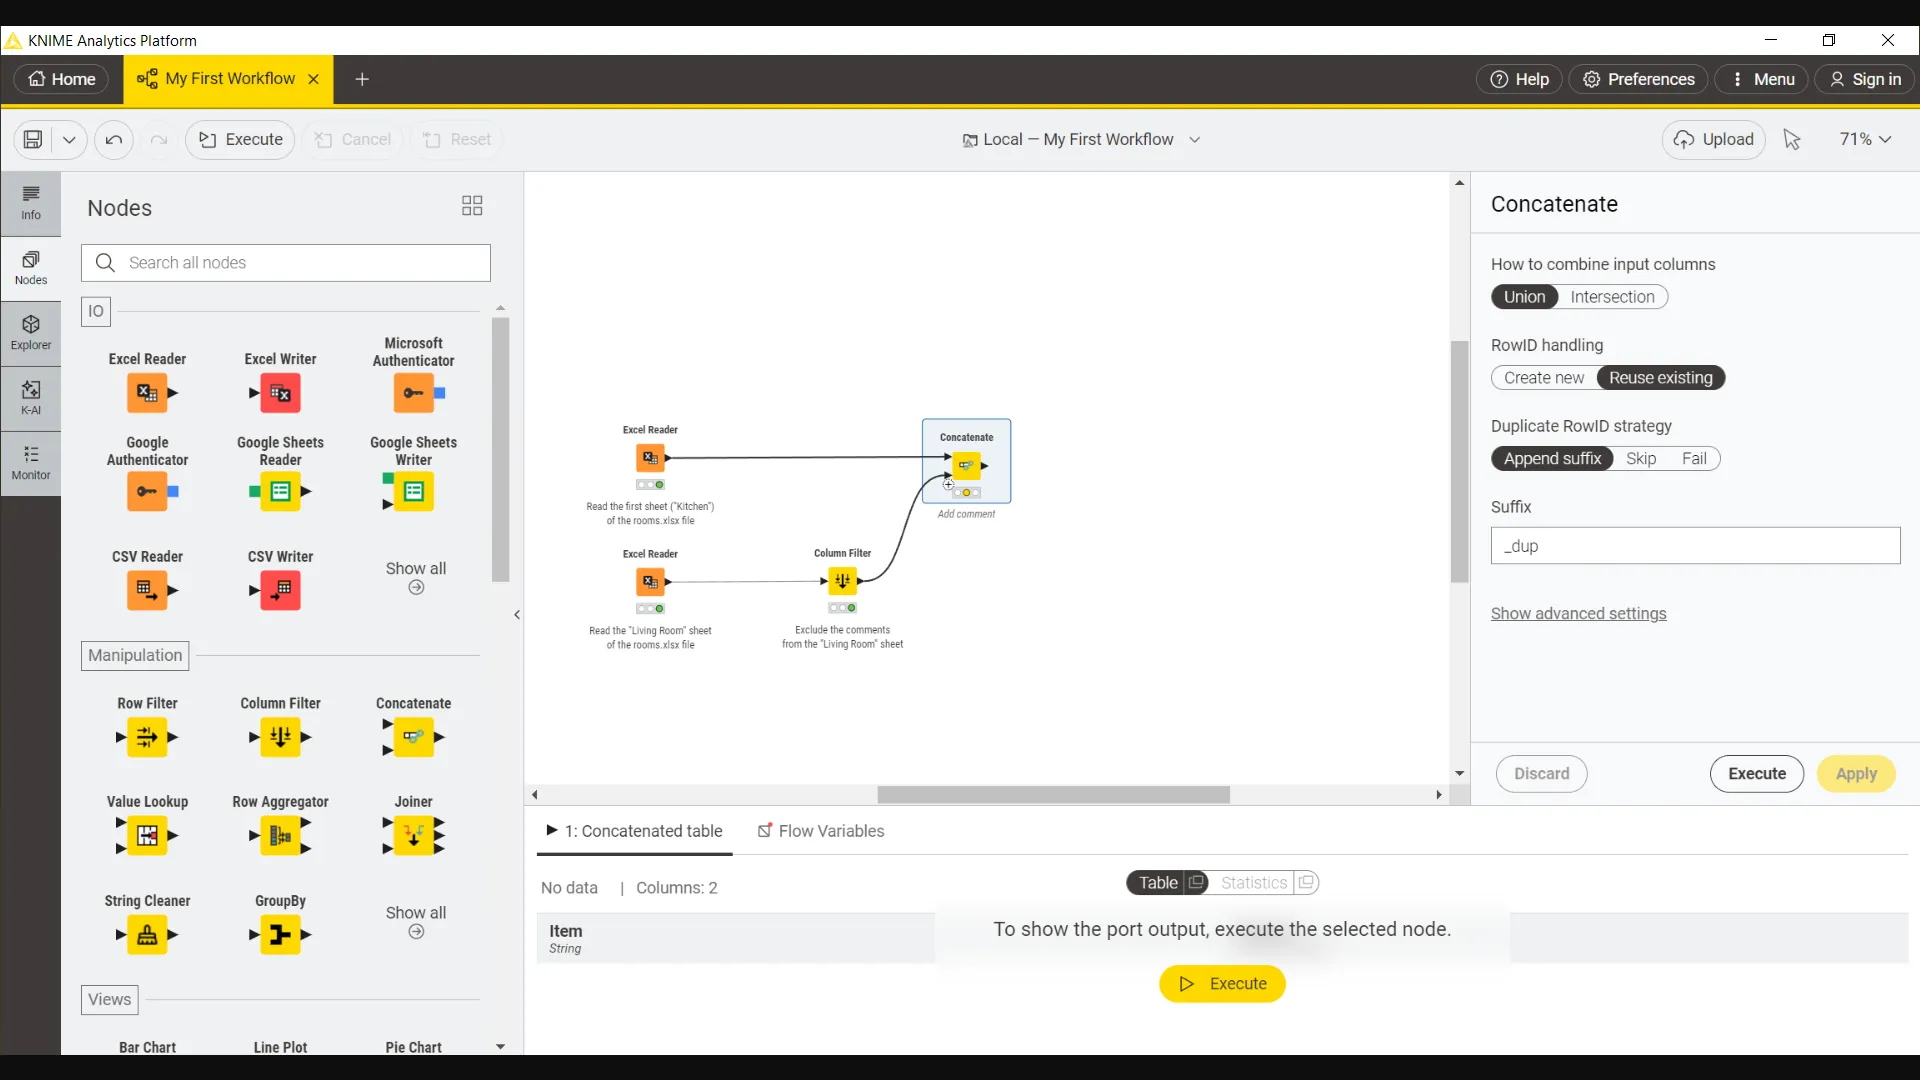
Two Excel inputs feed a Column Filter and Concatenate node, making the merge step visible in the workflow.
Product pricing — KNIME Analytics Platform
KNIME Analytics Platform is free. KNIME Hub and team deployment use capacity-based plans. Contact KNIME for a current quote.
How much does the same analytics workload cost?
For five teammates, private workspace access runs from $0 with Data Studio to $2,916 for one Tableau Creator and four Explorers. The table shows the closest published setup for each product, before tax and extra capacity.
| Product | Five-person configuration | Annual list cost | What is included or changes the comparison |
|---|---|---|---|
| Power BI | 5 Pro users | $840 | All five need Pro in ordinary shared capacity. E5 or qualifying Fabric capacity may reduce incremental licensing |
| Tableau Cloud Standard | 1 Creator + 4 Explorers | $2,916 | Explorers can create from published data sources. At least one Creator is required |
| Data Studio | 5 self-service users | $0 | Standard sharing is free. Pro adds project-level administration and support at $540/year for one project |
| Zoho Analytics | Standard, 5 users | $576 | Includes 1 million rows. 25 read-only viewers add $960/year if that audience is needed |
| Metabase Starter | 5 users | $1,080 | Annual cloud plan includes first five users. Self-hosting shifts infrastructure and maintenance to your team |
| KNIME | No equivalent shared-reporting seat plan | Not comparable | Free desktop supports local workflows. Shared execution uses a separate capacity-based plan |
For one analyst working with a small file, Power BI Desktop, Data Studio, Zoho's free plan, and KNIME all have a no-license-cost route. Each has a limit: Windows for Desktop, cloud sharing for Data Studio, a 10,000-row cap for Zoho, and local workflows for KNIME. If E5 already includes Pro, Power BI's extra license cost can also be zero. Tableau lets you assign Viewer seats, while Zoho's Viewer add-on starts at 25 people. Count the people who need access before you compare totals.
Metabase Open Source also has no license fee, but you need a database and must handle hosting yourself. Each free route comes with a different workflow and privacy trade-off.
Which data analysis software should you choose if you already have a subscription?
Start with Sheets, Power Query, or Excel if your team already pays for them and only needs one-off cleanup. A spreadsheet might be enough for that job. For recurring refreshes, several sources, and governed reports, a dedicated analytics tool may justify its license and setup cost.
Other tools we considered
Already pay for Microsoft or Google? Start with Excel or Sheets for a small cleanup before buying another tool. Python with Jupyter and R with Posit offer programmable statistical work; Hex is another collaborative notebook. Each serves a different workflow from these dashboard and visual-prep picks.